Trading Idea:
Short from 79,50-79,80!
Support & resistance:
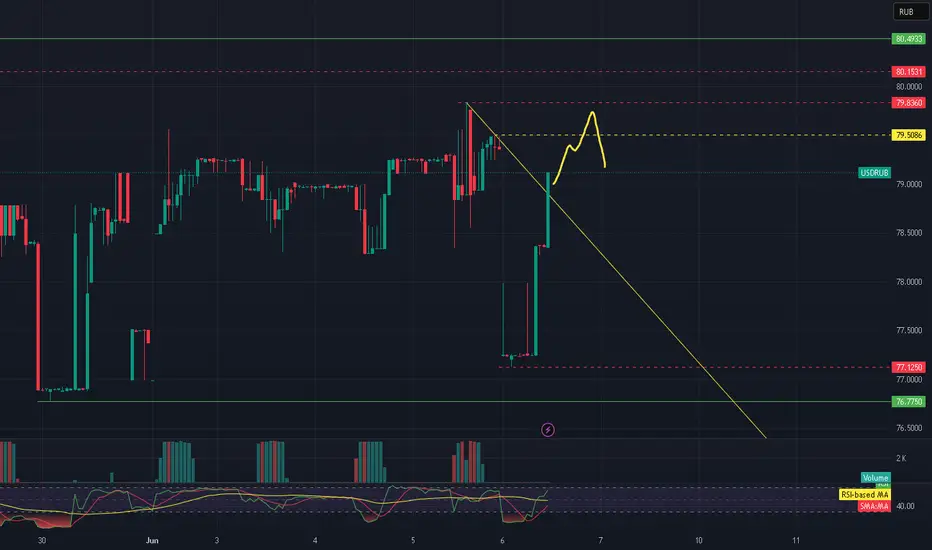
🔴 Resistance Levels:
79.8360 — the nearest key resistance level, previously acted as a pullback and profit-taking zone.
80.1531 — strong resistance from which the last downward impulse originated.
80.4933 — the upper boundary of the range; serves as a potential target if the price breaks higher.
🟡 Support Levels:
79.5086 — local support level, where price may consolidate after breaking the descending trendline.
77.1250 — a confirmed level where downward momentum previously halted.
76.7750 — important support zone from which the current bullish impulse started.
🔍 Additional Notes:
Price has confidently broken above the descending trendline and is testing the 79.50 level — a potential setup for consolidation and continuation upward.
RSI has exited the oversold zone, confirming bullish momentum.
Volume increased on the upward impulse, supporting the probability of further upward movement.
Short from 79,50-79,80!
Support & resistance:
🔴 Resistance Levels:
79.8360 — the nearest key resistance level, previously acted as a pullback and profit-taking zone.
80.1531 — strong resistance from which the last downward impulse originated.
80.4933 — the upper boundary of the range; serves as a potential target if the price breaks higher.
🟡 Support Levels:
79.5086 — local support level, where price may consolidate after breaking the descending trendline.
77.1250 — a confirmed level where downward momentum previously halted.
76.7750 — important support zone from which the current bullish impulse started.
🔍 Additional Notes:
Price has confidently broken above the descending trendline and is testing the 79.50 level — a potential setup for consolidation and continuation upward.
RSI has exited the oversold zone, confirming bullish momentum.
Volume increased on the upward impulse, supporting the probability of further upward movement.
면책사항
해당 정보와 게시물은 금융, 투자, 트레이딩 또는 기타 유형의 조언이나 권장 사항으로 간주되지 않으며, 트레이딩뷰에서 제공하거나 보증하는 것이 아닙니다. 자세한 내용은 이용 약관을 참조하세요.
면책사항
해당 정보와 게시물은 금융, 투자, 트레이딩 또는 기타 유형의 조언이나 권장 사항으로 간주되지 않으며, 트레이딩뷰에서 제공하거나 보증하는 것이 아닙니다. 자세한 내용은 이용 약관을 참조하세요.