Price on 
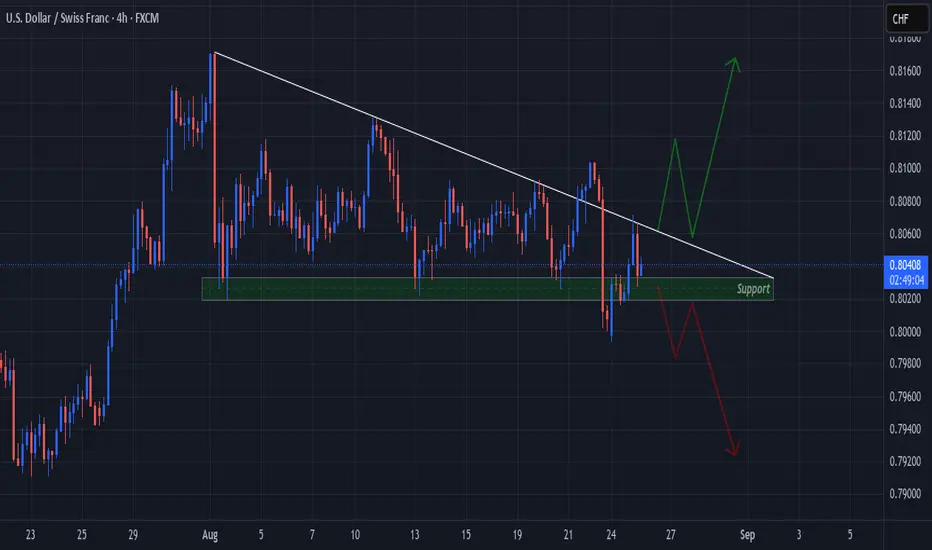
 USDCHF has been falling in a Descending Triangle Pattern shown here on the 4Hr Chart.
Price ending last week created 2 False Breakouts of both the Falling Resistance and Horizontal Support!
Price soon will be looking to make a Breakout with it consolidating tighter into the Apex of the Triangle.
Once a Breakout is validated, we will want to see a Retest!
Price ending last week created 2 False Breakouts of both the Falling Resistance and Horizontal Support!
Price soon will be looking to make a Breakout with it consolidating tighter into the Apex of the Triangle.
Once a Breakout is validated, we will want to see a Retest!
For All Things Currency,
Keep It Current,
With Novi Fibonacci!
Keep It Current,
With Novi Fibonacci!
관련 발행물
면책사항
이 정보와 게시물은 TradingView에서 제공하거나 보증하는 금융, 투자, 거래 또는 기타 유형의 조언이나 권고 사항을 의미하거나 구성하지 않습니다. 자세한 내용은 이용 약관을 참고하세요.
For All Things Currency,
Keep It Current,
With Novi Fibonacci!
Keep It Current,
With Novi Fibonacci!
관련 발행물
면책사항
이 정보와 게시물은 TradingView에서 제공하거나 보증하는 금융, 투자, 거래 또는 기타 유형의 조언이나 권고 사항을 의미하거나 구성하지 않습니다. 자세한 내용은 이용 약관을 참고하세요.