📈 USDCAD – Bullish Setup Forming Above Key EMAs
USDCAD is showing a clean bullish structure:
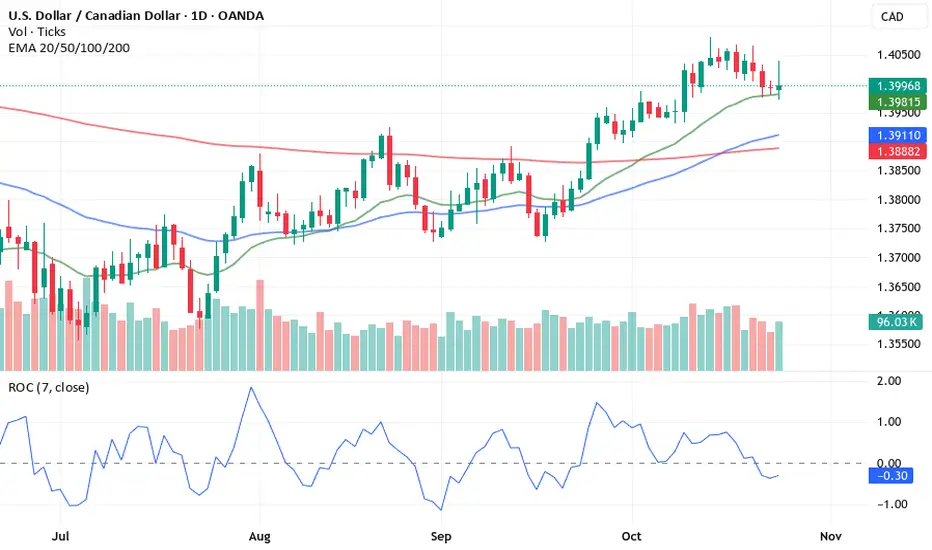
Price is trading above the 20 EMA, 50 EMA, and 200 EMA – confirming an overall uptrend.
The latest candlestick formed a spinning top / long upper shadow while touching the 20 EMA support zone.
This indicates fear and hesitation from buyers, but at the same time, sellers failed to push price below the 20 EMA.
🟢 Bullish Bias:
As long as price holds above the 20 EMA, I expect buyers to step back in and push USDCAD higher.
A breakout above the recent candle’s high could confirm bullish continuation.
⚠️ Invalidation Level:
A clean break and close below the 20 EMA could weaken this setup and shift momentum.
Key Levels to Watch:
💬 This is not financial advice. For educational purposes only.
USDCAD is showing a clean bullish structure:
Price is trading above the 20 EMA, 50 EMA, and 200 EMA – confirming an overall uptrend.
The latest candlestick formed a spinning top / long upper shadow while touching the 20 EMA support zone.
This indicates fear and hesitation from buyers, but at the same time, sellers failed to push price below the 20 EMA.
🟢 Bullish Bias:
As long as price holds above the 20 EMA, I expect buyers to step back in and push USDCAD higher.
A breakout above the recent candle’s high could confirm bullish continuation.
⚠️ Invalidation Level:
A clean break and close below the 20 EMA could weaken this setup and shift momentum.
Key Levels to Watch:
- Support: 20 EMA / dynamic zone
- Resistance: Recent swing high
- Trend: Bullish above 50 EMA and 200 EMA
💬 This is not financial advice. For educational purposes only.
면책사항
이 정보와 게시물은 TradingView에서 제공하거나 보증하는 금융, 투자, 거래 또는 기타 유형의 조언이나 권고 사항을 의미하거나 구성하지 않습니다. 자세한 내용은 이용 약관을 참고하세요.
면책사항
이 정보와 게시물은 TradingView에서 제공하거나 보증하는 금융, 투자, 거래 또는 기타 유형의 조언이나 권고 사항을 의미하거나 구성하지 않습니다. 자세한 내용은 이용 약관을 참고하세요.