analysis of the USD/CAD 2-hour chart you provided:
Technical Breakdown:
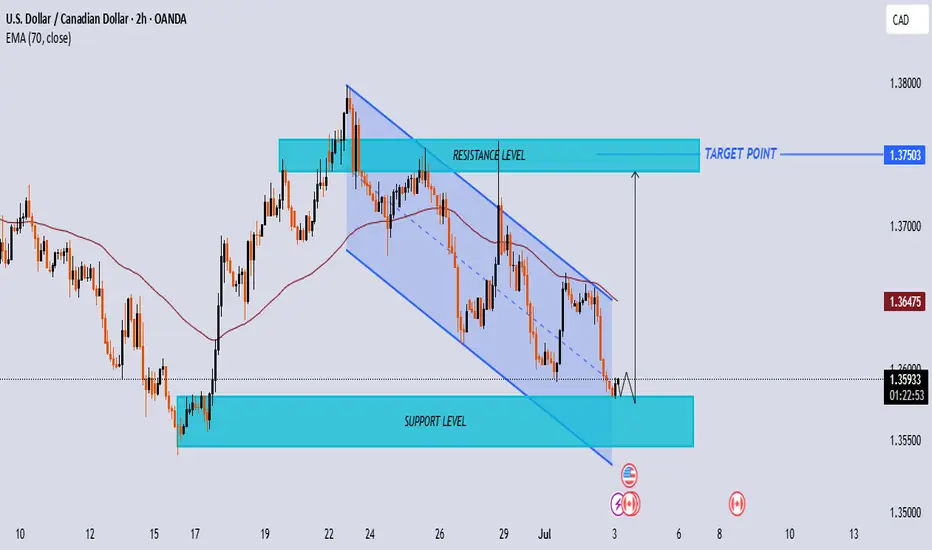
📉 Downtrend Channel (Falling Wedge)
Price is moving within a descending channel structure (marked with blue lines).
The market has been making lower highs and lower lows, typical of a bearish trend.
Key Levels:
✅ Support Zone: Around 1.35500 - 1.35800
Price has reached this strong support zone.
Previous price reactions from this area suggest buying interest.
✅ Resistance Zone: Around 1.36800 - 1.37200
Identified as the next major obstacle for bullish movement.
✅ Target Point: 1.37503
Marked as the final potential bullish target if price breaks above resistance.
Indicators:
70 EMA (Exponential Moving Average) currently at 1.36475
Price is trading below the EMA, confirming the short-term bearish pressure.
A breakout above EMA may support bullish momentum.
Price Action Expectation:
⚡ Bullish Scenario:
If price holds at the support zone and breaks out of the descending channel:
Expect a reversal towards the resistance zone.
If that breaks, price may target 1.37503, completing a potential bullish reversal pattern.
⚠️ Bearish Scenario:
If price fails to hold the support zone:
A breakdown below 1.35500 could trigger further downside.
Next significant support likely around 1.35000.
Summary:
Market is at a key decision zone.
Watching for:
Rejection and breakout above the falling wedge → Bullish opportunity.
Breakdown below support → Bearish continuation.
Technical Breakdown:
📉 Downtrend Channel (Falling Wedge)
Price is moving within a descending channel structure (marked with blue lines).
The market has been making lower highs and lower lows, typical of a bearish trend.
Key Levels:
✅ Support Zone: Around 1.35500 - 1.35800
Price has reached this strong support zone.
Previous price reactions from this area suggest buying interest.
✅ Resistance Zone: Around 1.36800 - 1.37200
Identified as the next major obstacle for bullish movement.
✅ Target Point: 1.37503
Marked as the final potential bullish target if price breaks above resistance.
Indicators:
70 EMA (Exponential Moving Average) currently at 1.36475
Price is trading below the EMA, confirming the short-term bearish pressure.
A breakout above EMA may support bullish momentum.
Price Action Expectation:
⚡ Bullish Scenario:
If price holds at the support zone and breaks out of the descending channel:
Expect a reversal towards the resistance zone.
If that breaks, price may target 1.37503, completing a potential bullish reversal pattern.
⚠️ Bearish Scenario:
If price fails to hold the support zone:
A breakdown below 1.35500 could trigger further downside.
Next significant support likely around 1.35000.
Summary:
Market is at a key decision zone.
Watching for:
Rejection and breakout above the falling wedge → Bullish opportunity.
Breakdown below support → Bearish continuation.
join my tellegram channel
t.me/+yhY0QtYtM0g0NWM0
join my refferal broker
one.exnesstrack.org/a/g565sj1uo7?source=app
t.me/+yhY0QtYtM0g0NWM0
join my refferal broker
one.exnesstrack.org/a/g565sj1uo7?source=app
면책사항
이 정보와 게시물은 TradingView에서 제공하거나 보증하는 금융, 투자, 거래 또는 기타 유형의 조언이나 권고 사항을 의미하거나 구성하지 않습니다. 자세한 내용은 이용 약관을 참고하세요.