Technical Analysis of USDCAD chart
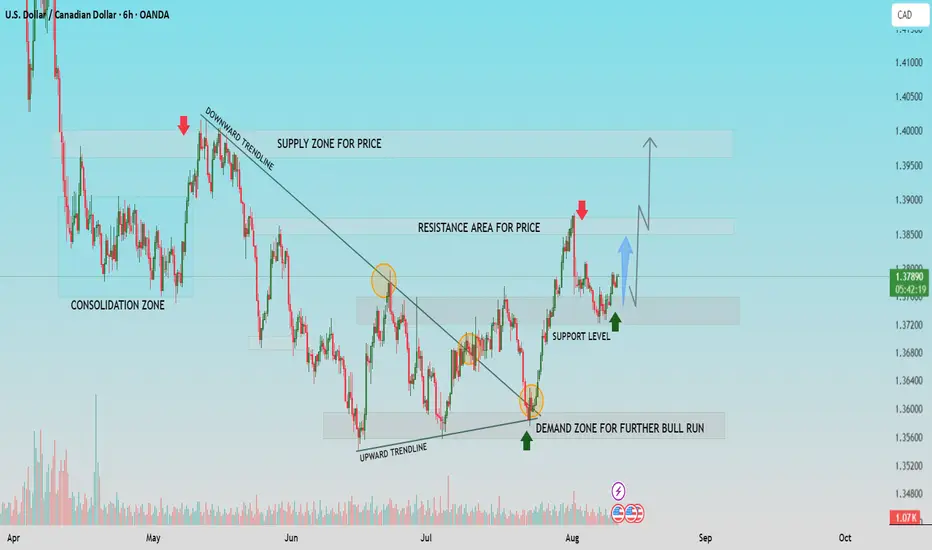
1. Market Structure Shift
Price has transitioned from a downward trendline to an upward trendline, signaling a shift from bearish to bullish sentiment. This structural change indicates that buyers are gaining control of the market.
2. Key Demand Zone Driving the Rally
The 1.3570-1.3620 demand zone acted as a strong base for the recent bullish move. This area represents where buyers aggressively stepped in, triggering a sustained rally toward higher levels.
3. Current Support Level Holding Firm
After rejecting the resistance area, price is consolidating above the support level around 1.3750-1.3780. Holding this level is crucial for the continuation of the uptrend.
4. Resistance and Breakout Potential
The 1.3850-1.3900 resistance area is the immediate hurdle for bulls. A breakout and close above this zone would likely attract further buying pressure, targeting the 1.4000 supply zone.
5. Bullish Continuation Outlook
As long as the support level remains intact, the technical bias is bullish. Pullbacks into support may provide buying opportunities, with upside targets toward 1.3900 and potentially 1.4000. A break below support would be the first sign of possible trend weakness.
If this helpful for you, press the like button.
액티브 트레이드
노트
hold your trades, 노트
100 pips+ achieved , set BE거래청산: 타겟 닿음
💸FREE FOREX Signals in Telegram : t.me/FxInsightsHub0
🔹Join Our Telegram Channel, Pure Price Action Based Signals With Chart Analysis.
t.me/FxInsightsHub0
🚀FREE CRYPTO Signals In Telegram: t.me/FxInsightsHub0
🔹Join Our Telegram Channel, Pure Price Action Based Signals With Chart Analysis.
t.me/FxInsightsHub0
🚀FREE CRYPTO Signals In Telegram: t.me/FxInsightsHub0
관련 발행물
면책사항
이 정보와 게시물은 TradingView에서 제공하거나 보증하는 금융, 투자, 거래 또는 기타 유형의 조언이나 권고 사항을 의미하거나 구성하지 않습니다. 자세한 내용은 이용 약관을 참고하세요.