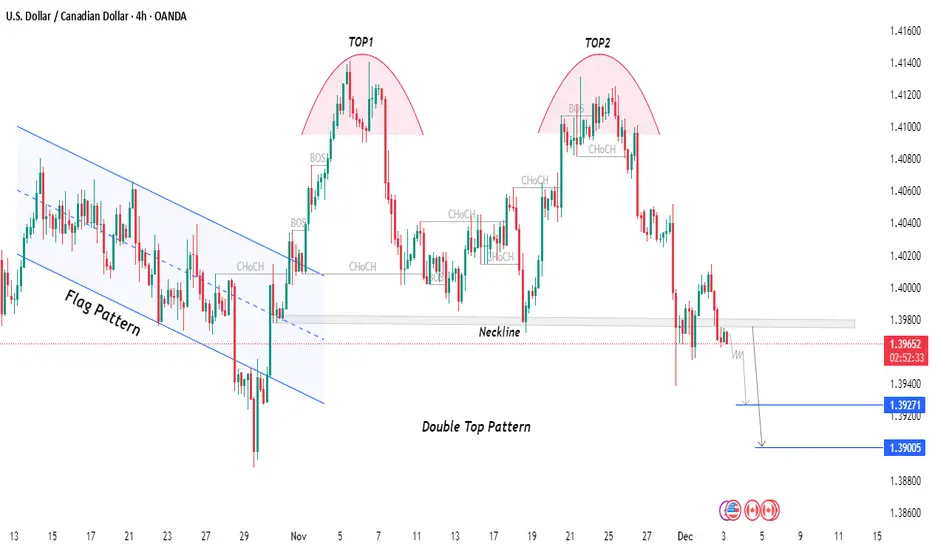
USDCAD has completed a Double Top Pattern after failing to break above the 1.4100 region twice. Price has now broken below the neckline, indicating a potential shift toward a bearish continuation.
Flag Pattern Breakout – Earlier bullish momentum ended after the flag breakout, but the structure later shifted.
Double Top (TOP1 & TOP2) – Clear rejection from the same supply region shows weakening bullish pressure.
Neckline Break – Price has broken the neckline support, which often confirms the double-top reversal.
Market Structure – Multiple CHOCH and BOS signals highlight increasing bearish order flow.
Downside Targets – If bearish pressure continues, next key levels sit near 1.3927 and 1.3900, where liquidity and previous reactions exist.
This analysis is for educational purposes only — always use proper risk management and confirm with your own strategy.
액티브 트레이드
♾️ Join my Telegram // Real Trade ; Real Result // 💱 Gold signal ; Forex signal ; Free signal
t.me/HGFDT5TtUy6Nm7H
t.me/HGFDT5TtUy6Nm7H
면책사항
해당 정보와 게시물은 금융, 투자, 트레이딩 또는 기타 유형의 조언이나 권장 사항으로 간주되지 않으며, 트레이딩뷰에서 제공하거나 보증하는 것이 아닙니다. 자세한 내용은 이용 약관을 참조하세요.
♾️ Join my Telegram // Real Trade ; Real Result // 💱 Gold signal ; Forex signal ; Free signal
t.me/HGFDT5TtUy6Nm7H
t.me/HGFDT5TtUy6Nm7H
면책사항
해당 정보와 게시물은 금융, 투자, 트레이딩 또는 기타 유형의 조언이나 권장 사항으로 간주되지 않으며, 트레이딩뷰에서 제공하거나 보증하는 것이 아닙니다. 자세한 내용은 이용 약관을 참조하세요.