🔍 1. Market Overview
🔸 Technical Outlook (4H Chart)
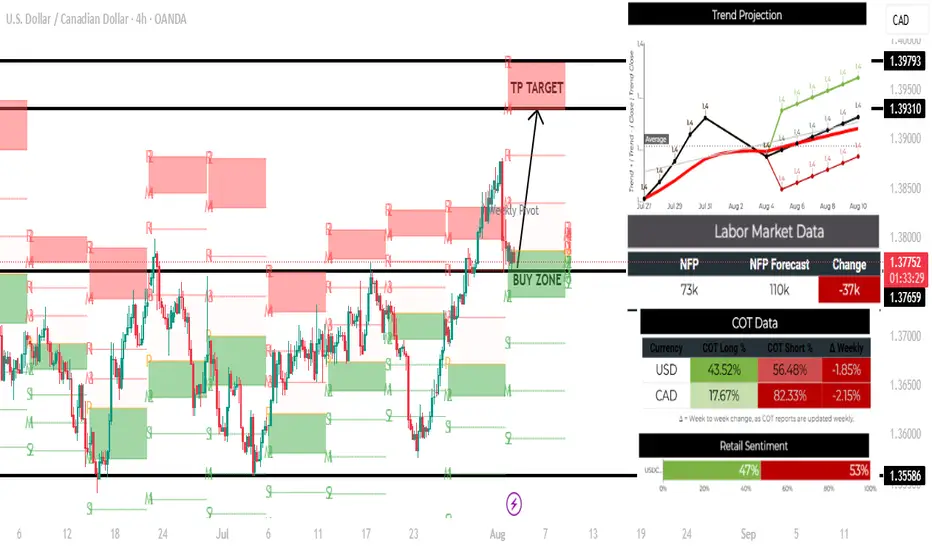
Price: Currently at 1.37792, just above a strong Buy Zone at 1.37659.
Structure: Bullish trend continuation with higher highs and higher lows.
Targets:
TP Target: Clearly marked at 1.39310 to 1.39793 resistance zone.
Support: Strong base near 1.37659; additional support at 1.35586.
Bias: Bullish, based on structure and rejection near support.
🔸 Trend Projection
The black average trend line shows price is likely to rebound upward starting August 4, aligning with the technical bullish zone.
Green projections suggest upside potential, supporting a long bias.
Red projections are possible but less likely based on current price structure and support strength.
📊 2. Fundamental Analysis
🔸 Labor Market (NFP Report)
Actual: 73k vs Forecast: 110k → -37k miss (Bearish for USD)
Impact: Weak U.S. labor data could temporarily weaken USD, but CAD is even weaker fundamentally (see below), making USDCAD likely to still rise.
🔸 COT (Commitment of Traders) Data
USD: Net short (43.52% long vs 56.48% short) → Slightly bearish.
CAD: Extremely bearish (17.67% long vs 82.33% short).
Net Positioning Bias: Bullish USDCAD (weaker CAD sentiment outweighs USD weakness).
🔸 Retail Sentiment
Retail is 53% Short vs 47% Long → Slightly more traders are betting against USDCAD.
Contrarian View: Retail traders are often wrong at turning points, which adds to bullish bias.
✅ 3. Trade Plan
🟢 Entry Plan
Entry Zone: Between 1.37659 and 1.37800 (buy zone, minor retracement area).
Confirmation: Look for a bullish candlestick reversal pattern (hammer, engulfing) on 1H/4H timeframe.
🎯 Take Profit (TP)
Primary TP: 1.39310 (strong resistance & marked TP target).
Extended TP: 1.39793 (monthly resistance level).
🛑 Stop Loss (SL)
Below support: 1.37250, just below the buy zone to avoid noise.
📌 4. Risk-Reward Ratio
Entry: ~1.3779
SL: 1.3725 (≈54 pips)
TP: 1.3931 (≈152 pips)
R:R ≈ 1:2.8 → Solid setup
⚠️ 5. Risk & News Events
Be aware of upcoming CAD data or USD CPI/inflation releases.
If risk sentiment worsens globally (e.g., oil prices rise → CAD strength), consider tightening stop or partial profits.
🔸 Technical Outlook (4H Chart)
Price: Currently at 1.37792, just above a strong Buy Zone at 1.37659.
Structure: Bullish trend continuation with higher highs and higher lows.
Targets:
TP Target: Clearly marked at 1.39310 to 1.39793 resistance zone.
Support: Strong base near 1.37659; additional support at 1.35586.
Bias: Bullish, based on structure and rejection near support.
🔸 Trend Projection
The black average trend line shows price is likely to rebound upward starting August 4, aligning with the technical bullish zone.
Green projections suggest upside potential, supporting a long bias.
Red projections are possible but less likely based on current price structure and support strength.
📊 2. Fundamental Analysis
🔸 Labor Market (NFP Report)
Actual: 73k vs Forecast: 110k → -37k miss (Bearish for USD)
Impact: Weak U.S. labor data could temporarily weaken USD, but CAD is even weaker fundamentally (see below), making USDCAD likely to still rise.
🔸 COT (Commitment of Traders) Data
USD: Net short (43.52% long vs 56.48% short) → Slightly bearish.
CAD: Extremely bearish (17.67% long vs 82.33% short).
Net Positioning Bias: Bullish USDCAD (weaker CAD sentiment outweighs USD weakness).
🔸 Retail Sentiment
Retail is 53% Short vs 47% Long → Slightly more traders are betting against USDCAD.
Contrarian View: Retail traders are often wrong at turning points, which adds to bullish bias.
✅ 3. Trade Plan
🟢 Entry Plan
Entry Zone: Between 1.37659 and 1.37800 (buy zone, minor retracement area).
Confirmation: Look for a bullish candlestick reversal pattern (hammer, engulfing) on 1H/4H timeframe.
🎯 Take Profit (TP)
Primary TP: 1.39310 (strong resistance & marked TP target).
Extended TP: 1.39793 (monthly resistance level).
🛑 Stop Loss (SL)
Below support: 1.37250, just below the buy zone to avoid noise.
📌 4. Risk-Reward Ratio
Entry: ~1.3779
SL: 1.3725 (≈54 pips)
TP: 1.3931 (≈152 pips)
R:R ≈ 1:2.8 → Solid setup
⚠️ 5. Risk & News Events
Be aware of upcoming CAD data or USD CPI/inflation releases.
If risk sentiment worsens globally (e.g., oil prices rise → CAD strength), consider tightening stop or partial profits.
면책사항
이 정보와 게시물은 TradingView에서 제공하거나 보증하는 금융, 투자, 거래 또는 기타 유형의 조언이나 권고 사항을 의미하거나 구성하지 않습니다. 자세한 내용은 이용 약관을 참고하세요.
면책사항
이 정보와 게시물은 TradingView에서 제공하거나 보증하는 금융, 투자, 거래 또는 기타 유형의 조언이나 권고 사항을 의미하거나 구성하지 않습니다. 자세한 내용은 이용 약관을 참고하세요.