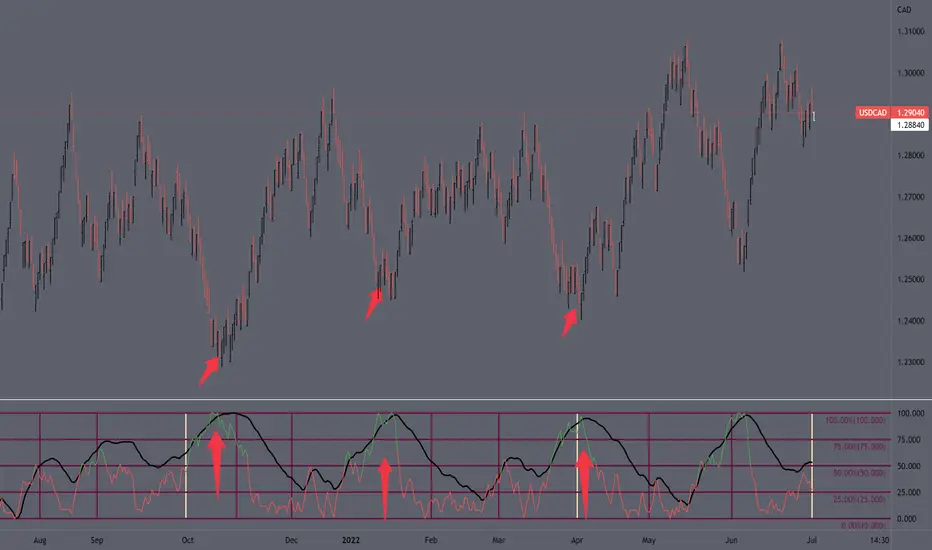
This was an interesting find using the EMA on Implied vol indicator. Looking at the technicals below the bar chart price has rallied 3 out of 3 times when this has happened during oct 2021 and April 2022. Along with the rallies have come the sell offs unlike the rallies the black EMA and the vix fix line track each other as the market sells off causing the red line to turn green and signal the next market rallies. I have still have to do back testing with it being this accurate it my be repainting.
Heres a link to my chart tradingview.com/chart/eGcjASRE/
Heres a link to my chart tradingview.com/chart/eGcjASRE/
면책사항
해당 정보와 게시물은 금융, 투자, 트레이딩 또는 기타 유형의 조언이나 권장 사항으로 간주되지 않으며, 트레이딩뷰에서 제공하거나 보증하는 것이 아닙니다. 자세한 내용은 이용 약관을 참조하세요.
면책사항
해당 정보와 게시물은 금융, 투자, 트레이딩 또는 기타 유형의 조언이나 권장 사항으로 간주되지 않으며, 트레이딩뷰에서 제공하거나 보증하는 것이 아닙니다. 자세한 내용은 이용 약관을 참조하세요.