1. What Happened Yesterday
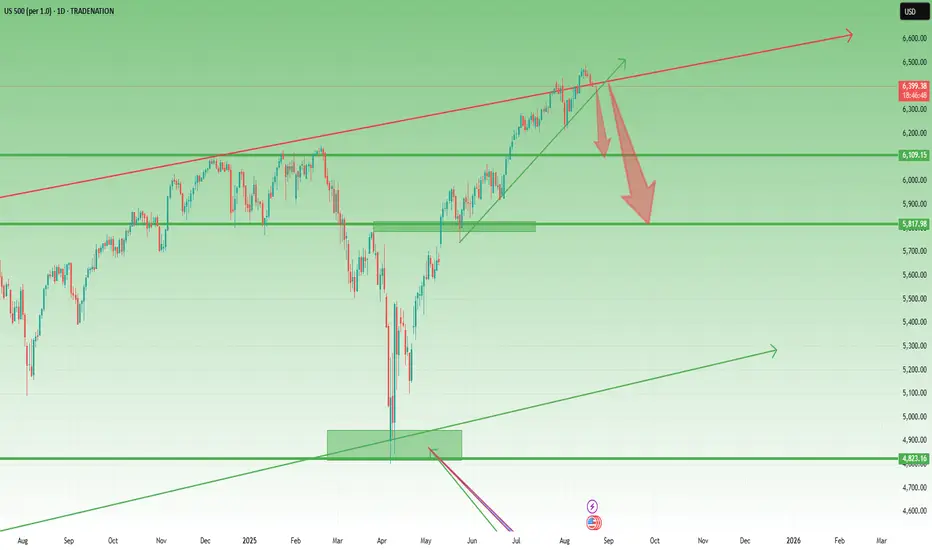
Yesterday, US500 dropped around 1%, signaling that a meaningful correction could be starting. Unlike Nasdaq, which already broke under two key support levels, here the price is still above the trendline that began back at the end of May, when the index broke through the important 5800 resistance.
The rise since April has been huge and not fundamentally justified, making the index vulnerable to a reversal towards more sustainable levels.
________________________________________
2. Key Question
Has the correction really started, or will we first see another spike before the drop?
________________________________________
3. Why More Downside is Likely
• Trendline vulnerability: A break under 6380 could trigger acceleration to the downside.
• First bear target: 6100, the old ATH.
• Bigger picture: A move under 6000 remains likely, with 5800 as a longer-term destination.
• Risk/reward setup: Any spike higher should be seen as a selling opportunity. Around 6500 would be ideal to short.
________________________________________
4. Trading Plan
• Sell spikes, especially near 6500).
• Watch 6380 – break here could open the way towards 6100.
• Medium/long term bias: Bearish, with more room down than up.
________________________________________
5. Final Note 🚀
The market must confirm, but the strategy is clear: don’t chase the bounce, sell the strength and ride the correction.
Disclosure: I am part of TradeNation's Influencer program and receive a monthly fee for using their TradingView charts in my analyses and educational articles.
📈 Forex & XAU/USD Channel:
t.me/intradaytradingsignals
💎 Crypto Channel:
t.me/FanCryptocurrency
관련 발행물
면책사항
이 정보와 게시물은 TradingView에서 제공하거나 보증하는 금융, 투자, 거래 또는 기타 유형의 조언이나 권고 사항을 의미하거나 구성하지 않습니다. 자세한 내용은 이용 약관을 참고하세요.
📈 Forex & XAU/USD Channel:
t.me/intradaytradingsignals
💎 Crypto Channel:
t.me/FanCryptocurrency
관련 발행물
면책사항
이 정보와 게시물은 TradingView에서 제공하거나 보증하는 금융, 투자, 거래 또는 기타 유형의 조언이나 권고 사항을 의미하거나 구성하지 않습니다. 자세한 내용은 이용 약관을 참고하세요.