Description:
This idea showcases my Liquidity Grab Entry Signals strategy, optimized for US30.
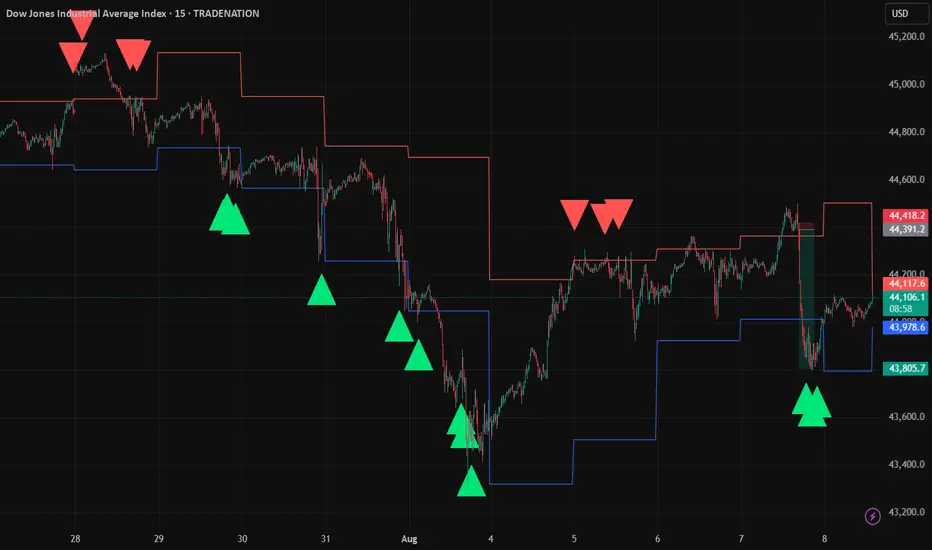
The setup identifies daily high/low liquidity zones with a sensitivity buffer, then confirms reversals using strong engulfing candles.
Key Points:
Daily Liquidity Levels plotted automatically.
Buffer Zone detects price interaction with liquidity.
Engulfing Confirmation for higher probability entries.
Long when price rejects daily low with bullish engulfing.
Short when price rejects daily high with bearish engulfing.
While the precision entries are taken on the 1-minute chart, this 15-minute chart is shown for publication purposes in line with TradingView rules.
Example (Yesterday & Today):
Multiple clean rejections at daily liquidity zones.
Clear 1:15–1:20 R:R potential with minimal drawdown.
Risk Management:
Suggested SL: 10–15 points beyond liquidity zone.
Suggested TP: the next key level.
Precise 1 min entry shown here:
https://www.tradingview.com/x/Adqh8dJk/
This idea showcases my Liquidity Grab Entry Signals strategy, optimized for US30.
The setup identifies daily high/low liquidity zones with a sensitivity buffer, then confirms reversals using strong engulfing candles.
Key Points:
Daily Liquidity Levels plotted automatically.
Buffer Zone detects price interaction with liquidity.
Engulfing Confirmation for higher probability entries.
Long when price rejects daily low with bullish engulfing.
Short when price rejects daily high with bearish engulfing.
While the precision entries are taken on the 1-minute chart, this 15-minute chart is shown for publication purposes in line with TradingView rules.
Example (Yesterday & Today):
Multiple clean rejections at daily liquidity zones.
Clear 1:15–1:20 R:R potential with minimal drawdown.
Risk Management:
Suggested SL: 10–15 points beyond liquidity zone.
Suggested TP: the next key level.
Precise 1 min entry shown here:
https://www.tradingview.com/x/Adqh8dJk/
🔗 Pro & custom indicators:
chartedgepro.gumroad.com/l/rmnbhw
✅ Clean signals: VWAP • FVG • CHoCH • Liquidity
📈 VWAP + FVG + CHoCH + Liquidity grab
Follow for US30, Nasdaq, Gold & Forex setups
chartedgepro.gumroad.com/l/rmnbhw
✅ Clean signals: VWAP • FVG • CHoCH • Liquidity
📈 VWAP + FVG + CHoCH + Liquidity grab
Follow for US30, Nasdaq, Gold & Forex setups
면책사항
해당 정보와 게시물은 금융, 투자, 트레이딩 또는 기타 유형의 조언이나 권장 사항으로 간주되지 않으며, 트레이딩뷰에서 제공하거나 보증하는 것이 아닙니다. 자세한 내용은 이용 약관을 참조하세요.