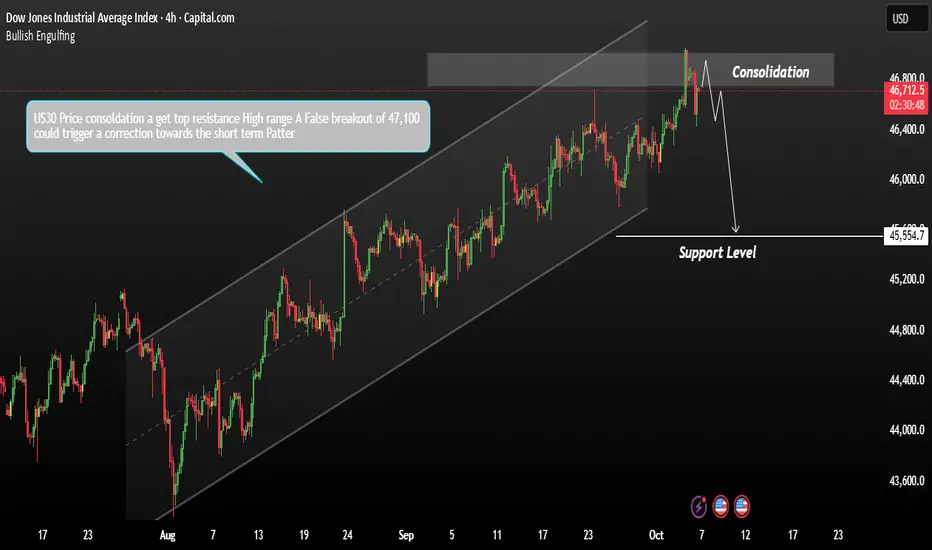
The US30 has recently shown strong consolidation near its top resistance zone, forming a new record high around 47,100. However, the breakout above this level appears to be losing momentum, raising the possibility of a false breakout.
If price fails to hold above 47,100 and shows signs of rejection, this could trigger a short-term corrective move each key support and resistance zone highlighted on the chart remains critical to watch. The market’s reaction — whether a clean breakout or a rejection — will likely determine the next directional move should the index respect the current resistance and reverse, the next significant short-term support to monitor is located near 45,500.
You may find more details in the chart.
Trade wisely best of luck.
Ps; Support with like and comments for better analysis Thanks for Supporting.
액티브 트레이드
Join My telegram Channel
t.me/AnalysisGold2
Free Forex Signals
t.me/Jamessignals11
t.me/AnalysisGold2
Free Forex Signals
t.me/Jamessignals11
관련 발행물
면책사항
해당 정보와 게시물은 금융, 투자, 트레이딩 또는 기타 유형의 조언이나 권장 사항으로 간주되지 않으며, 트레이딩뷰에서 제공하거나 보증하는 것이 아닙니다. 자세한 내용은 이용 약관을 참조하세요.
Join My telegram Channel
t.me/AnalysisGold2
Free Forex Signals
t.me/Jamessignals11
t.me/AnalysisGold2
Free Forex Signals
t.me/Jamessignals11
관련 발행물
면책사항
해당 정보와 게시물은 금융, 투자, 트레이딩 또는 기타 유형의 조언이나 권장 사항으로 간주되지 않으며, 트레이딩뷰에서 제공하거나 보증하는 것이 아닙니다. 자세한 내용은 이용 약관을 참조하세요.