DOW JONES rejection finding Support soon.
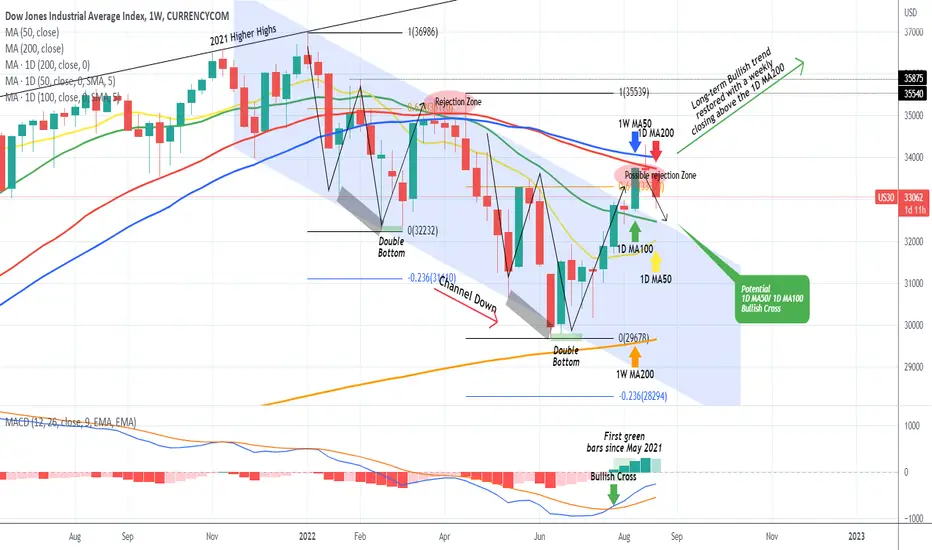
Exactly 2 weeks ago on our last Dow Jones (DJI) analysis we stated that the price had entered a possible rejection zone (red) and unless it closed a weekly (1W) candle above the 1D MA200, we would get a pull-back:

Well as it turned out the index closed last week below both the 1D MA200 (red trend-line) and the 1W MA50 (blue trend-line), which are very close to each other, and got a considerable rejection this week. The price is now approaching the critical Support cluster that consists of the 1D MA100 (green trend-line) and the 1D MA50 (yellow trend-line). The chances of getting a new bounce are high as not only are wee on a 1W MACD Bullish Cross since late July but also the 1D MA50 is about to cross above the 1D MA100, forming a Bullish Cross. Last time that happened was on after the June 15 2020 1W candle, which was the first recovery from the March 2020 COVID crash:

As you see, the 1D MA50 and 1D MA100 held as Support levels and Dow was able to sustain a solid rise. Technically there is no reason not to expect a similar development but in order to technically claim that the index is back onto the long-term bullish trend we need to see a weekly candle closing above the 1D MA200.
--------------------------------------------------------------------------------------------------------
** Please support this idea with your likes and comments, it is the best way to keep it relevant and support me. **
--------------------------------------------------------------------------------------------------------
Well as it turned out the index closed last week below both the 1D MA200 (red trend-line) and the 1W MA50 (blue trend-line), which are very close to each other, and got a considerable rejection this week. The price is now approaching the critical Support cluster that consists of the 1D MA100 (green trend-line) and the 1D MA50 (yellow trend-line). The chances of getting a new bounce are high as not only are wee on a 1W MACD Bullish Cross since late July but also the 1D MA50 is about to cross above the 1D MA100, forming a Bullish Cross. Last time that happened was on after the June 15 2020 1W candle, which was the first recovery from the March 2020 COVID crash:
As you see, the 1D MA50 and 1D MA100 held as Support levels and Dow was able to sustain a solid rise. Technically there is no reason not to expect a similar development but in order to technically claim that the index is back onto the long-term bullish trend we need to see a weekly candle closing above the 1D MA200.
--------------------------------------------------------------------------------------------------------
** Please support this idea with your likes and comments, it is the best way to keep it relevant and support me. **
--------------------------------------------------------------------------------------------------------
👑Best Signals (Forex/Crypto+70% accuracy) & Account Management (+20% profit/month on 10k accounts)
💰Free Channel t.me/tradingshotglobal
🤵Contact info@tradingshot.com t.me/tradingshot
🔥New service: next X100 crypto GEMS!
💰Free Channel t.me/tradingshotglobal
🤵Contact info@tradingshot.com t.me/tradingshot
🔥New service: next X100 crypto GEMS!
면책사항
해당 정보와 게시물은 금융, 투자, 트레이딩 또는 기타 유형의 조언이나 권장 사항으로 간주되지 않으며, 트레이딩뷰에서 제공하거나 보증하는 것이 아닙니다. 자세한 내용은 이용 약관을 참조하세요.