Brief Description🖊️:
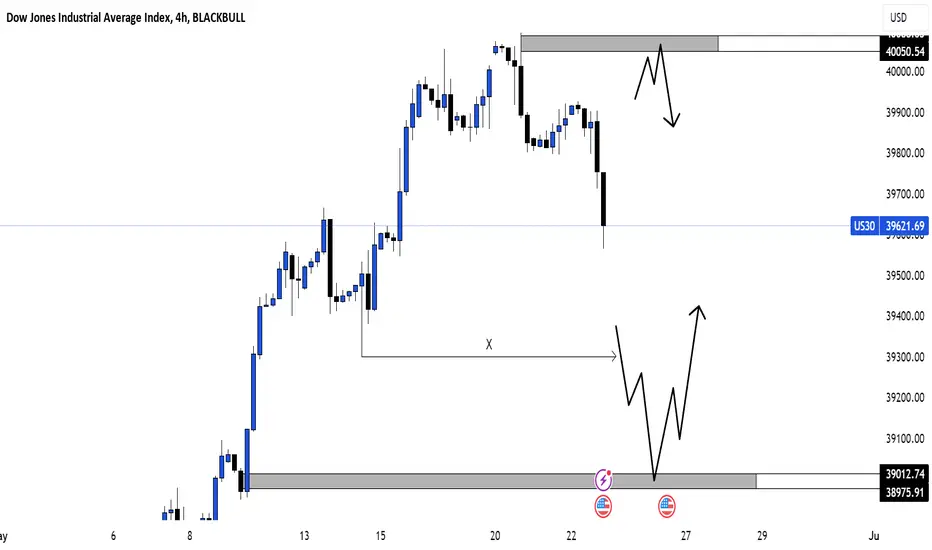
The chart provides insights into critical market levels, emphasizing an essential demand zone (medium-risk buy zone) spanning from 39013 to 38975. Additionally, medium-risk sell zone between 40050-40090, respectively, are highlighted.
Things I Have Seen👀:
Medium-Risk Buy Zone🟠: Noted between 39013 and 38975, suggesting another area with moderate risk for potential buying positions.
Medium-Risk Sell Zone🟠: Noted between 40050 and 40090, suggesting another area with moderate risk for potential selling positions.
Bearish Targets📉:
40000: Possible retracement area.
39900: Possible retracement area.
39800: Area with laying low liquidity.
Ultimate Target: 39600- Essential Demand Zone
Bullish Targets📈:
39300: Possible retracement area.
39560: Possible retracement area.
39700: Possible retracement area.
39850: Possible retracement area.
40100: Area with a lot of liquidity.
What's Important Now❗
Currently, the crucial approach is to wait and observe the price action at this level. We need to assess how the market reacts before considering any decisive moves. Stay observant and responsive to real-time developments in the market.
Join our Telegram Group for A+ Signals send out daily and for more outlooks like these:
Telegram Signal Group🎯: t.me/+vDw-7IDpPI5kNjQ8
Telegram Analysis Group👀: t.me/+dADZcFwXH2gzNDQ0
Telegram Signal Group🎯: t.me/+vDw-7IDpPI5kNjQ8
Telegram Analysis Group👀: t.me/+dADZcFwXH2gzNDQ0
면책사항
해당 정보와 게시물은 금융, 투자, 트레이딩 또는 기타 유형의 조언이나 권장 사항으로 간주되지 않으며, 트레이딩뷰에서 제공하거나 보증하는 것이 아닙니다. 자세한 내용은 이용 약관을 참조하세요.