US30 (Dow Jones) Technical Analysis – 4H Chart
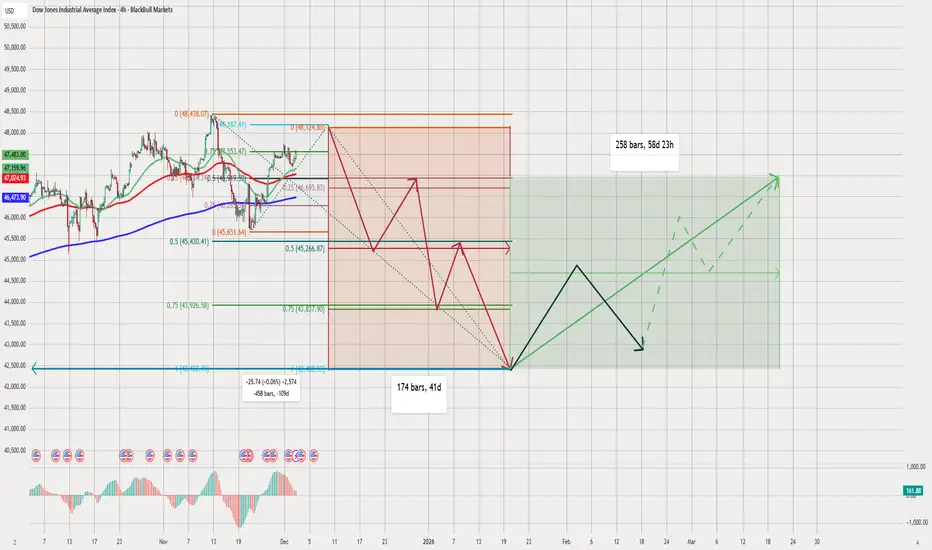
chart shows a well-structured bearish scenario, followed by a medium-term bullish reversal setup. combining Fibonacci retracement levels, time cycles, moving averages, and projected wave paths to map the market direction.
Below is a detailed breakdown:
1️⃣ Current Market Structure
Price recently reached a local top near 48,127.
After this, the chart suggests expect a significant downward correction.
Price is fluctuating above the:
Green MA (short-term)
Red MA (medium-term)
Blue 200 MA (long-term)
projected path shows a breakdown below these moving averages soon.
2️⃣ Fibonacci Levels (Important Zones)
From the recent high, your Fibonacci retracement levels are:
0.25 → 46,699
0.5 → 45,274
0.75 → 43,950
These levels align with your expected downward waves.
Major Support Zone
Large green zone near 41,700 – 42,200
This is where your final bearish wave ends
It also overlaps with a long-term Fibonacci cluster
This suggests it is the target bottom of the correction.
3️⃣ Bearish Projection (Red Wave Path)
chart shows multiple downward swings:
Initial drop from 48,127 → 45,274
Bounce to retest resistance
Deeper decline toward 44,000 – 43,500
Another bounce
Final capitulation to 41,700
🟥 Final Bearish Target:
~41,700
This matches the blue horizontal support line.
🔹 Duration of Bearish Cycle
174 bars (~41 days)
This suggests the decline completes around late January 2026.
4️⃣ Bullish Reversal Phase (Green + Black Path)
After reaching the bottom around 41,700, your chart shows two phases:
Phase 1 – Strong Rebound (Black Path)
A sharp rally into early February:
First rally to around 44,500 – 45,000
Short-term pullback
Then continuation higher
Phase 2 – Trend Recovery (Green Path)
Long-term green path shows:
A steady upward channel
Price aiming toward 48,000 – 49,000 again
The green dotted lines show alternative bullish scenarios
🔹 Total Recovery Time
258 bars (~58 days)
Targeting mid-March 2026 for a full recovery.
5️⃣ Interpretation of Moving Averages
Price will break below the moving averages during the correction.
Long-term recovery will push back above the:
50 MA (green)
100 MA (red)
200 MA (blue)
This confirms a trend reversal after the bottom is hit.
6️⃣ Summary of Your Outlook
📉 Short-Term Bias: Bearish
Price expected to drop from the top
Multiple lower highs / lower lows
Target bottom: 41,700
📉 Medium-Term Bias: Consolidation & Reversal
Strong bounce after the bottom
Wave structure suggests accumulation
📈 Long-Term Bias: Bullish
Recovery back toward all-time highs
Market structure returns to an uptrend by March 2026
✔️ Final Conclusion
chart suggests a full cycle:
Top formation near 48,127
Multi-wave decline (target 41,700)
41-day bearish cycle
Strong bullish reversal
Full recovery within ~58 days
This is a very clean Elliott-wave-style projection supported by Fibonacci and time cycles.
면책사항
해당 정보와 게시물은 금융, 투자, 트레이딩 또는 기타 유형의 조언이나 권장 사항으로 간주되지 않으며, 트레이딩뷰에서 제공하거나 보증하는 것이 아닙니다. 자세한 내용은 이용 약관을 참조하세요.
면책사항
해당 정보와 게시물은 금융, 투자, 트레이딩 또는 기타 유형의 조언이나 권장 사항으로 간주되지 않으며, 트레이딩뷰에서 제공하거나 보증하는 것이 아닙니다. 자세한 내용은 이용 약관을 참조하세요.