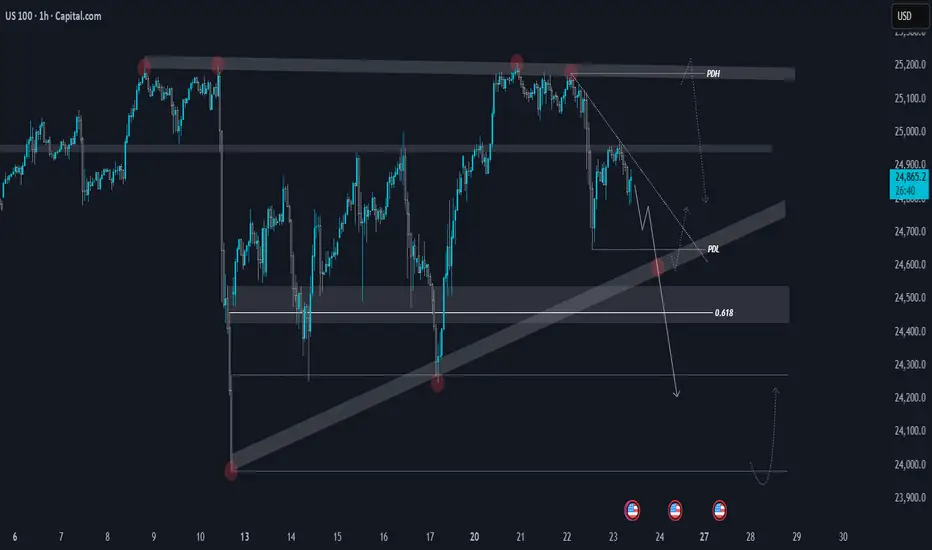
On the 4H timeframe, the index is approaching the trendline support around 24,600, which marks the third touch of this level. If this zone fails to hold, we could see an extended move toward the 24,000 area.
From a broader view, the daily chart shows a double top pattern along with a strong bearish divergence — both supporting a deeper pullback. However, a daily close above 25,220 would invalidate this view and could shift momentum back to the upside.
📰 With the ongoing U.S. government shutdown and heightened market uncertainty, sentiment remains mixed. Volatility is expected to stay elevated, so it’s best to wait for clear confirmation around key levels before taking any positions.
관련 발행물
면책사항
해당 정보와 게시물은 금융, 투자, 트레이딩 또는 기타 유형의 조언이나 권장 사항으로 간주되지 않으며, 트레이딩뷰에서 제공하거나 보증하는 것이 아닙니다. 자세한 내용은 이용 약관을 참조하세요.
관련 발행물
면책사항
해당 정보와 게시물은 금융, 투자, 트레이딩 또는 기타 유형의 조언이나 권장 사항으로 간주되지 않으며, 트레이딩뷰에서 제공하거나 보증하는 것이 아닙니다. 자세한 내용은 이용 약관을 참조하세요.