Symbol:
Timeframe: 30 Minutes
Indicators: OB/OS Overlap (RSI, MFI, Stochastic) + S/R
________________________________________
🔍 Quick Summary
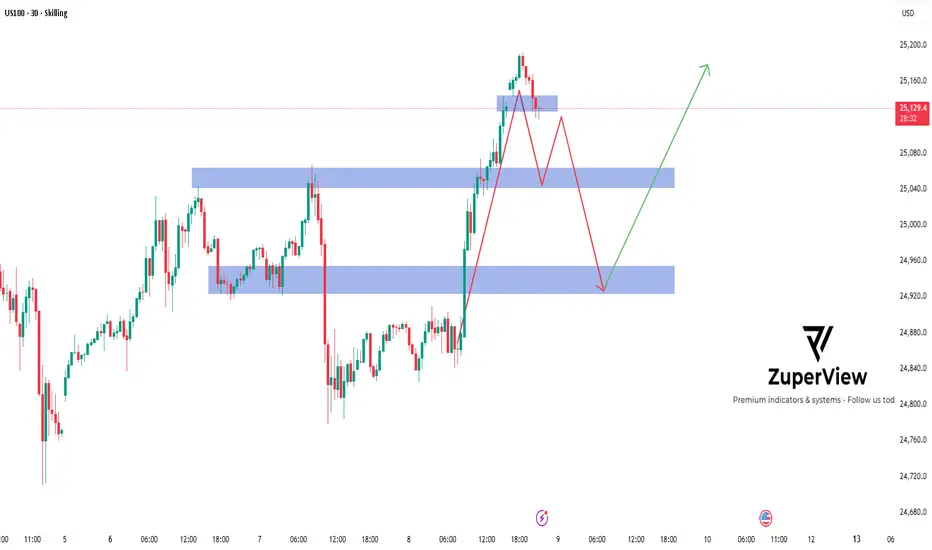
After a strong rally 🚀 from the 24,750–24,800 support area, US100 has reached the 25,280–25,300 resistance zone — where multiple oscillators are showing overbought signals.
This suggests potential profit-taking or a technical correction may occur soon.
________________________________________
📊 Price Structure
• Price formed a temporary top after tapping the overbought area, with clear rejection candles near resistance.
• A pullback toward the first support zone around 25,000–25,050 could occur before the next move.
• If selling pressure continues, the next target area lies near 24,800–24,850, where previous structure and demand overlap 📉.
________________________________________
🧩 Technical Highlights
• OB/OS Overlap: RSI, MFI, and Stochastic are all in overbought territory (3/3 alignment) — a strong early signal of potential short-term exhaustion.
• Price Action: A minor double top or bearish divergence may be forming if momentum indicators continue to decline.
• Key Zones: Blue zones on the chart mark areas of potential buyer reaction (demand).
________________________________________
🧭 Scenario Outlook
Main Scenario (🔻 Pullback Expected):
Price could retrace toward 25,000–24,850 before buyers attempt a rebound.
Alternative Scenario (🚀 Continuation):
If the price holds above 25,100 and breaks 25,280, the bullish momentum might continue short-term.
________________________________________
⚙️ Risk Note
This analysis is for educational purposes only and not financial advice.
Always manage risk carefully and align your trade plan with your own strategy 📘💡.
Market conditions can change rapidly — stay flexible and objective!
Please like and comment below to support our traders. Your reactions will motivate us to do more analysis in the future 🙏✨
Harry Andrew @ ZuperView
거래청산: 타겟 닿음
면책사항
해당 정보와 게시물은 금융, 투자, 트레이딩 또는 기타 유형의 조언이나 권장 사항으로 간주되지 않으며, 트레이딩뷰에서 제공하거나 보증하는 것이 아닙니다. 자세한 내용은 이용 약관을 참조하세요.
면책사항
해당 정보와 게시물은 금융, 투자, 트레이딩 또는 기타 유형의 조언이나 권장 사항으로 간주되지 않으며, 트레이딩뷰에서 제공하거나 보증하는 것이 아닙니다. 자세한 내용은 이용 약관을 참조하세요.