NASDAQ Daily Analysis 📊
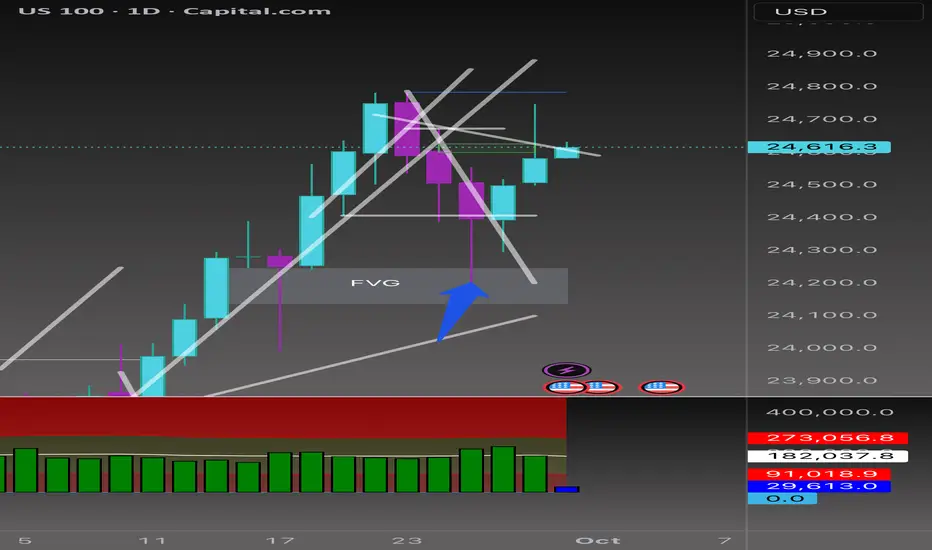
On the daily chart, the FVG formed on Sep 15th has been revisited, but price couldn't hold in this zone and was quickly rejected. The trendline I've drawn is still active and guiding the move.
⚡️Volatility note: Daily volatility is starting to compress (blue print on my model), meaning the next breakout move could expand strongly. If price breaks above the trendline with momentum, buyers may look beyond 24,650 toward 24,720–24,800 before reevaluating. If rejection holds, compressed volatility could fuel an accelerated drop into the 24,520 → 24,440 FVG zone, and possibly 24,300.
🦖 If a bullish candle closes back above the trendline, I’ll be looking at 24,650 as a buy trigger. A confirmed break here could open the door toward 24,720 → 24,780 liquidity levels.
🐼 If sellers keep control below the trend, downside targets remain at the FVGs around 24,520 → 24,440, and potentially 24,300 (Discount PD Array).
⚡️ Bottom line:
Today’s US data (Chicago PMI, JOLTS, Consumer Confidence) + multiple FOMC speeches will likely decide direction.
📉 Hot data or hawkish tone → sellers push deeper.
📈 Softer numbers or dovish Fed comments → bulls may retest higher levels.
관련 발행물
면책사항
해당 정보와 게시물은 금융, 투자, 트레이딩 또는 기타 유형의 조언이나 권장 사항으로 간주되지 않으며, 트레이딩뷰에서 제공하거나 보증하는 것이 아닙니다. 자세한 내용은 이용 약관을 참조하세요.
면책사항
해당 정보와 게시물은 금융, 투자, 트레이딩 또는 기타 유형의 조언이나 권장 사항으로 간주되지 않으며, 트레이딩뷰에서 제공하거나 보증하는 것이 아닙니다. 자세한 내용은 이용 약관을 참조하세요.