With price pushing into fresh all-time highs, reliable technical zones become harder to define due to the lack of historical data. This increases uncertainty and makes it essential to treat the zones as guidance rather than fixed buy or sell levels. Volatility tends to rise around record territory, so traders should remain cautious.
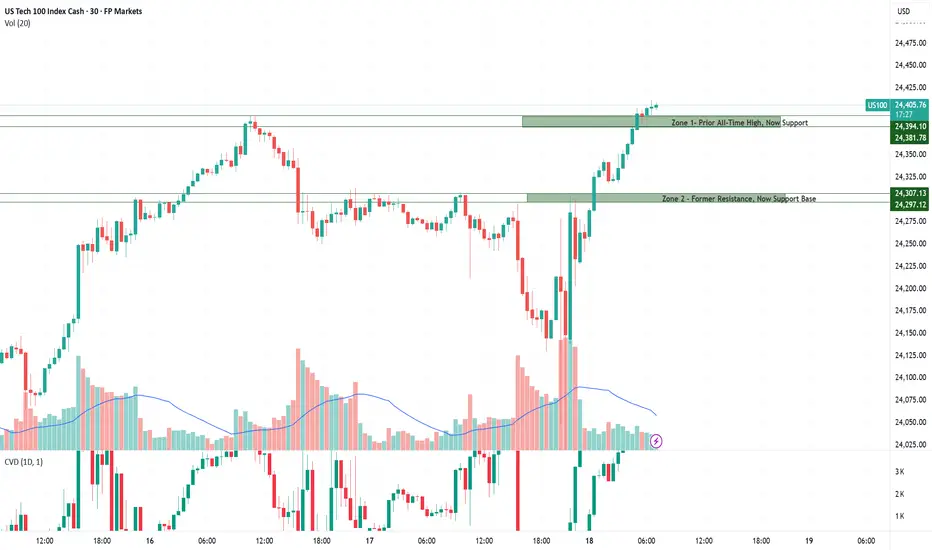
Zone 1 – Prior All-Time High, Now Support:
Yesterday’s all-time high has now turned into a support zone after being broken to the upside. This level may hold as a launchpad for further bullish continuation, but traders should remain cautious — if price drops back below, it could trigger a sharp reversal.
Zone 2 – Former Resistance, Now Support Base:
This area has been tested multiple times, making it a high-activity zone. Yesterday it acted as resistance, but after being broken, it now serves as support. Buyers may defend this area on a retest, but if it fails, momentum could shift quickly to the downside.
This area has been tested multiple times, making it a high-activity zone. Yesterday it acted as resistance, but after being broken, it now serves as support. Buyers may defend this area on a retest, but if it fails, momentum could shift quickly to the downside.
Market sentiment turned cautiously optimistic after the Fed delivered its first 25bp rate cut of the year, lowering the policy rate to 4.00–4.25%. Hopes for further easing later in 2025 are supportive for growth stocks and the Nasdaq-100, yet Powell’s remarks highlighted lingering risks from both inflation and a cooling labor market. As a result, volatility remains elevated, and while the bias is tilted higher, confidence in sustained momentum is still fragile.
면책사항
이 정보와 게시물은 TradingView에서 제공하거나 보증하는 금융, 투자, 거래 또는 기타 유형의 조언이나 권고 사항을 의미하거나 구성하지 않습니다. 자세한 내용은 이용 약관을 참고하세요.
면책사항
이 정보와 게시물은 TradingView에서 제공하거나 보증하는 금융, 투자, 거래 또는 기타 유형의 조언이나 권고 사항을 의미하거나 구성하지 않습니다. 자세한 내용은 이용 약관을 참고하세요.