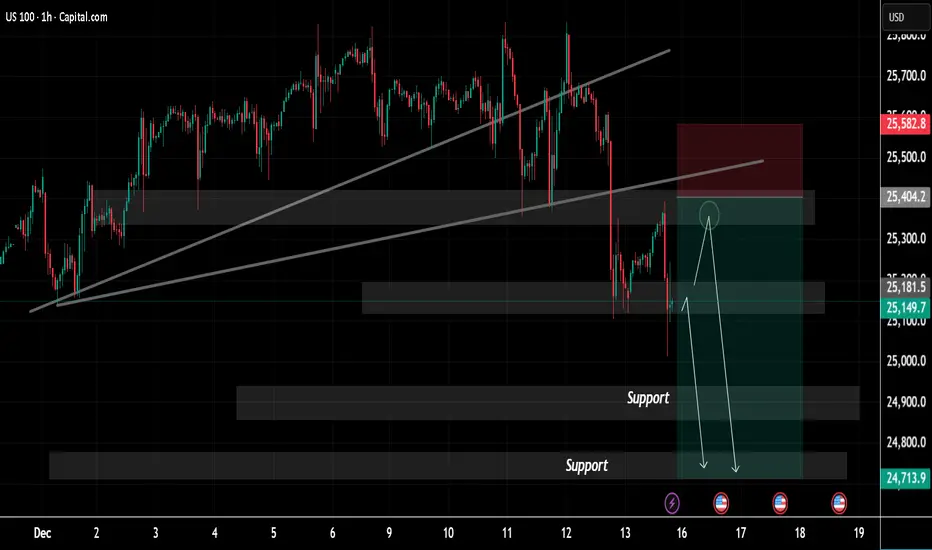
US100 on the 1-hour timeframe, highlighting a shift in market structure from bullish to bearish Price was previously moving within an ascending channel, respecting higher highs and higher low a strong bearish breakdown occurred, with price decisively breaking below the rising trendline, indicating a loss of bullish momentum the sharp sell-off suggests institutional distribution and a potential trend reversal.
Resistance Zone (≈ 25,400 – 25,580)
Immediate Support (≈ 25,150 – 25,200)
These are marked demand/support areas and are likely downside targets if bearish momentum continues we could see support 24,900 to 24,700
The projected arrows indicate a possible retracement toward resistance, followed by continuation to the downside as long as price remains below the broken trendline and resistance zone, the bearish bias remains valid buyers appear weak, while sellers maintain control.
If you find it helpful please like and comments for this post and share thanks.
액티브 트레이드
1st Target reached
✅FREE FOREX Signals in Telegram
t.me/thedollarpipskiller
✅ Suggest News Channel
t.me/addlist/5h3Y2WG2eyVkOTY0
t.me/thedollarpipskiller
✅ Suggest News Channel
t.me/addlist/5h3Y2WG2eyVkOTY0
관련 발행물
면책사항
해당 정보와 게시물은 금융, 투자, 트레이딩 또는 기타 유형의 조언이나 권장 사항으로 간주되지 않으며, 트레이딩뷰에서 제공하거나 보증하는 것이 아닙니다. 자세한 내용은 이용 약관을 참조하세요.