I have a chart open on TradingView in the monthly time frame.
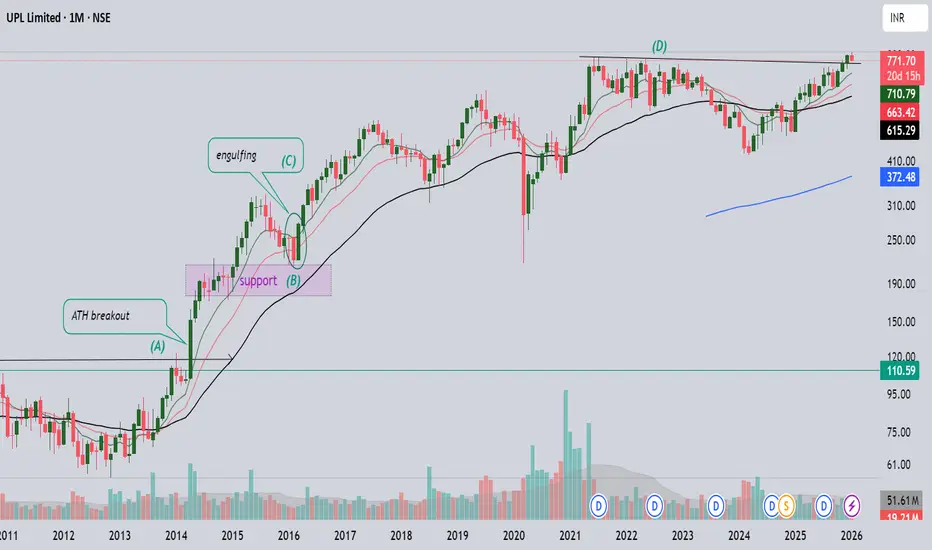
The focus here is on identifying entry opportunities using support and resistance levels. The black trend line on the chart shows a clear all-time high breakout, which could have been a valid entry point. After the breakout, the stock moved up slightly and then entered horizontal consolidation.
This previous all-time high now acts as a support zone.
The stock we are analyzing is UPL Limited. Once again, we have seen an all-time high breakout followed by consolidation. The long-term trend line, respected since June 2021, has now been broken by the December 2025 monthly candle.
The key thing to watch going forward is whether this newly formed mini support holds.
면책사항
해당 정보와 게시물은 금융, 투자, 트레이딩 또는 기타 유형의 조언이나 권장 사항으로 간주되지 않으며, 트레이딩뷰에서 제공하거나 보증하는 것이 아닙니다. 자세한 내용은 이용 약관을 참조하세요.
면책사항
해당 정보와 게시물은 금융, 투자, 트레이딩 또는 기타 유형의 조언이나 권장 사항으로 간주되지 않으며, 트레이딩뷰에서 제공하거나 보증하는 것이 아닙니다. 자세한 내용은 이용 약관을 참조하세요.