Description:
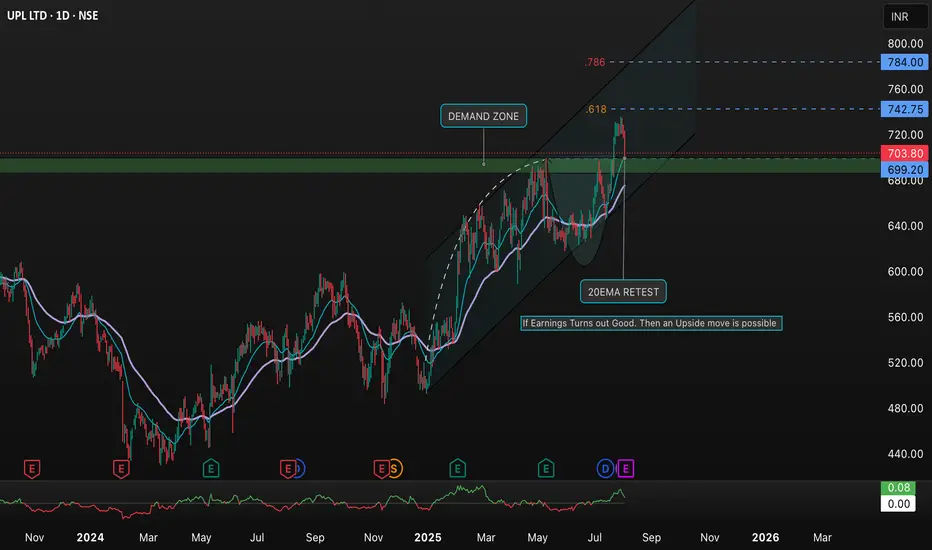
This chart analyzes UPL LTD (NSE:UPL) on the daily timeframe. Key highlights include:
• Demand Zone: The chart marks a demand zone where buying interest is expected to be strong.
• Fibonacci Levels: Major resistance at the 0.618 and 0.786 Fibonacci retracement zones (around 720 and 784).
• Current Price Action: Stock is trading near 703.80, showing a recent pullback after testing higher levels.
• 20EMA Retest: The price recently retested the 20 EMA, a critical support.
• Upside Potential: Watch for an upside move if upcoming earnings turn out positive. Key upside targets: 742, 760, and 784.
• Strategy Note: Monitor the demand zone for support and watch for breakouts above resistance for potential bullish confirmation.
Ideal for traders looking to capitalize on support/resistance and trend-following strategies.
면책사항
이 정보와 게시물은 TradingView에서 제공하거나 보증하는 금융, 투자, 거래 또는 기타 유형의 조언이나 권고 사항을 의미하거나 구성하지 않습니다. 자세한 내용은 이용 약관을 참고하세요.
면책사항
이 정보와 게시물은 TradingView에서 제공하거나 보증하는 금융, 투자, 거래 또는 기타 유형의 조언이나 권고 사항을 의미하거나 구성하지 않습니다. 자세한 내용은 이용 약관을 참고하세요.