The current situation:
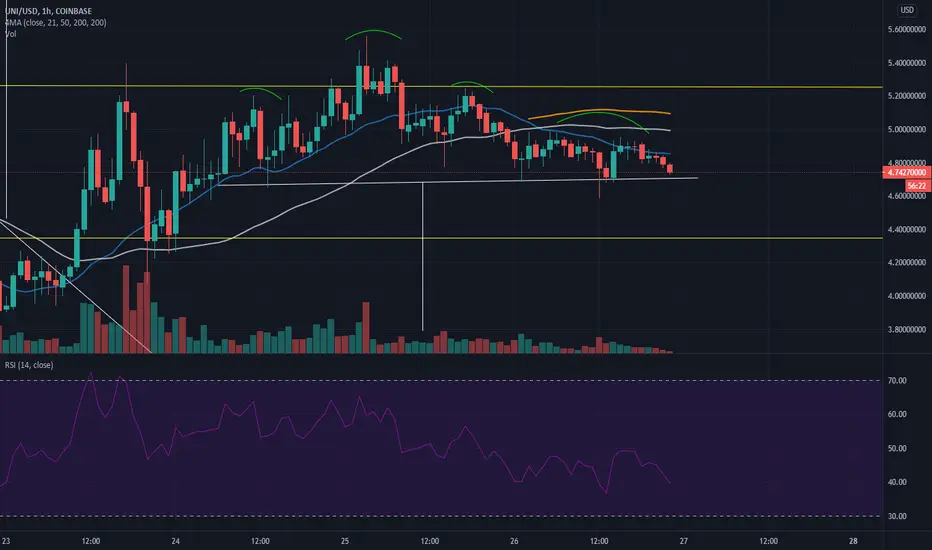
1. The price action previously failed to break out of the ascending triangle that was in (see my previous posts) and now it looks bearish as a head and shoulders pattern is more apparent on the 1HR chart. The price action has also broken below the 4HR 21MA and now the moving average that is acting as support is the 6HR 21MA. This is also at about the neckline of the head and shoulders pattern, with a measured target of about 3.8 USD
The bullish case:
1. The price action bounces off the 6HR and retry the resistance at about 5.25 USD
The bearish case:
1. Price action breaks below the 6HR 21MA, under which the next level of support is the 0.786 FIB level at about 4.35 USD
*Let me know in the comment section if you agree or disagree, would love to hear your ideas too.
*These are purely my speculations and not financial advice. You should always do your own due diligence before trading or investing.
면책사항
이 정보와 게시물은 TradingView에서 제공하거나 보증하는 금융, 투자, 거래 또는 기타 유형의 조언이나 권고 사항을 의미하거나 구성하지 않습니다. 자세한 내용은 이용 약관을 참고하세요.
면책사항
이 정보와 게시물은 TradingView에서 제공하거나 보증하는 금융, 투자, 거래 또는 기타 유형의 조언이나 권고 사항을 의미하거나 구성하지 않습니다. 자세한 내용은 이용 약관을 참고하세요.