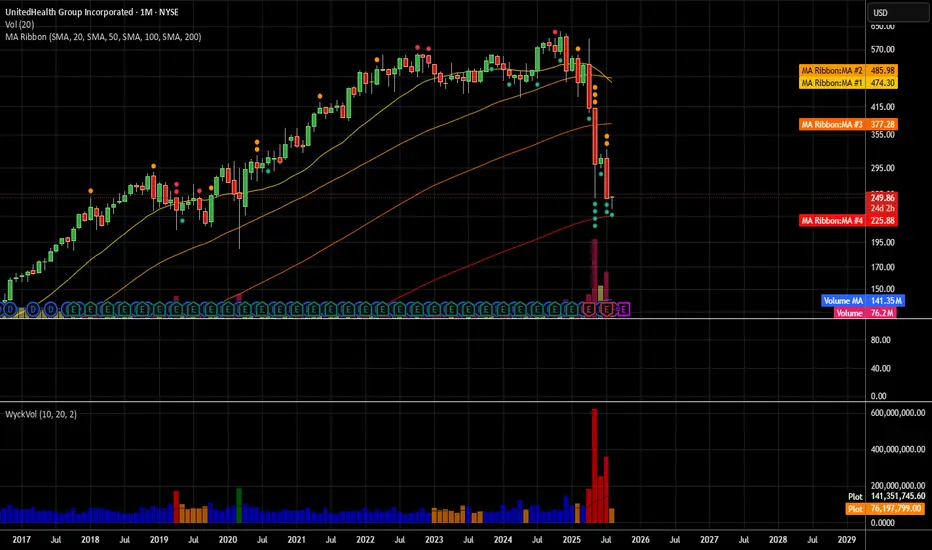
The price is currently around $250.51, rebounding after a steep drop.
There’s strong volume spike on the recent candles, suggesting capitulation selling and potential reversal.
The price is sitting near the SMA 200 on the monthly chart which historically acts as major long-term support.
Overhead resistance MAs: SMA/EMA 20/50 around $267–$280.
📈 Bullish Target Zones
First target (T1): $267 – near the 20/50 EMA/SMA cluster, where initial resistance is likely.
Second target (T2): $280–$285 – prior consolidation zone before breakdown.
Stretch target (T3): $300 – 310 retest of breakdown highs.
면책사항
이 정보와 게시물은 TradingView에서 제공하거나 보증하는 금융, 투자, 거래 또는 기타 유형의 조언이나 권고 사항을 의미하거나 구성하지 않습니다. 자세한 내용은 이용 약관을 참고하세요.
면책사항
이 정보와 게시물은 TradingView에서 제공하거나 보증하는 금융, 투자, 거래 또는 기타 유형의 조언이나 권고 사항을 의미하거나 구성하지 않습니다. 자세한 내용은 이용 약관을 참고하세요.