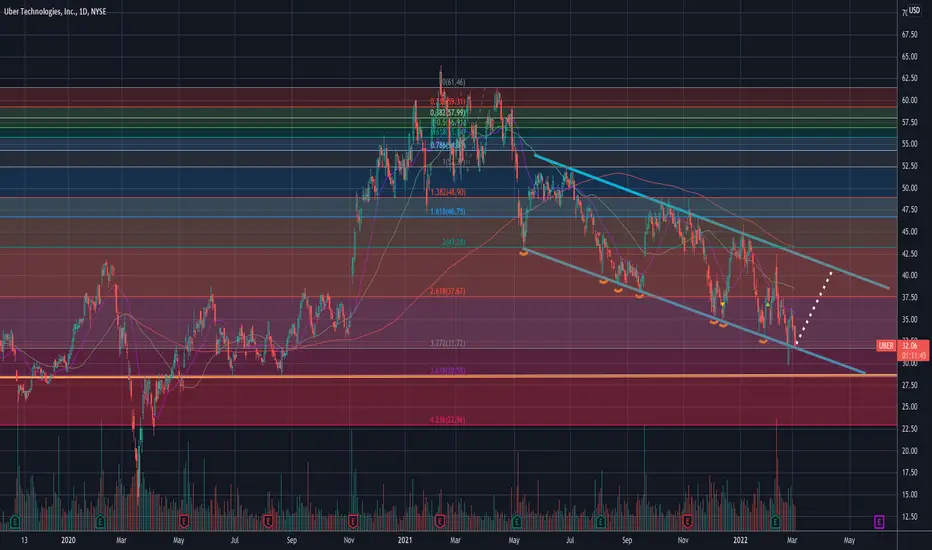
Uber has been in a down trend channel and currently trading at the lower trend line of the channel. The question is will it bounce from here or will it break below the lower trend line?
Per fib extension, $31.72 area could be a support. However, a better support would be $28.58 (the yellow line). If the price breaks down to $28.58, it would mean the price has broken below the channel. It's extremely bearish.
But if we look at the history, the area has acted as support multiple times in the past.
A bull might bet that the price will bounce from 31.72 area and head towards $37.67 with a tight stop loss at $31.
A safer entry would be around $28.58 again with a tight stop loss at $26.
It's hard to trade in the current headline driven environment.
How would you play?
———————————————————
How to read my charts?
- Matching color trend lines shows the pattern. Sometimes a chart can have multiple patterns. Each pattern will have matching color trend lines.
- The yellow horizontal lines show support and resistance areas.
- Fib lines also show support and resistance areas.
- The dotted white lines show the price projection for breakout or breakdown target.
Disclaimer: Not investment advice.
I am not a licensed professional. None of the posts that I published are investment advice. Do your own research.
면책사항
이 정보와 게시물은 TradingView에서 제공하거나 보증하는 금융, 투자, 거래 또는 기타 유형의 조언이나 권고 사항을 의미하거나 구성하지 않습니다. 자세한 내용은 이용 약관을 참고하세요.
I am not a licensed professional. None of the posts that I published are investment advice. Do your own research.
면책사항
이 정보와 게시물은 TradingView에서 제공하거나 보증하는 금융, 투자, 거래 또는 기타 유형의 조언이나 권고 사항을 의미하거나 구성하지 않습니다. 자세한 내용은 이용 약관을 참고하세요.