TTEC (NASDAQ)
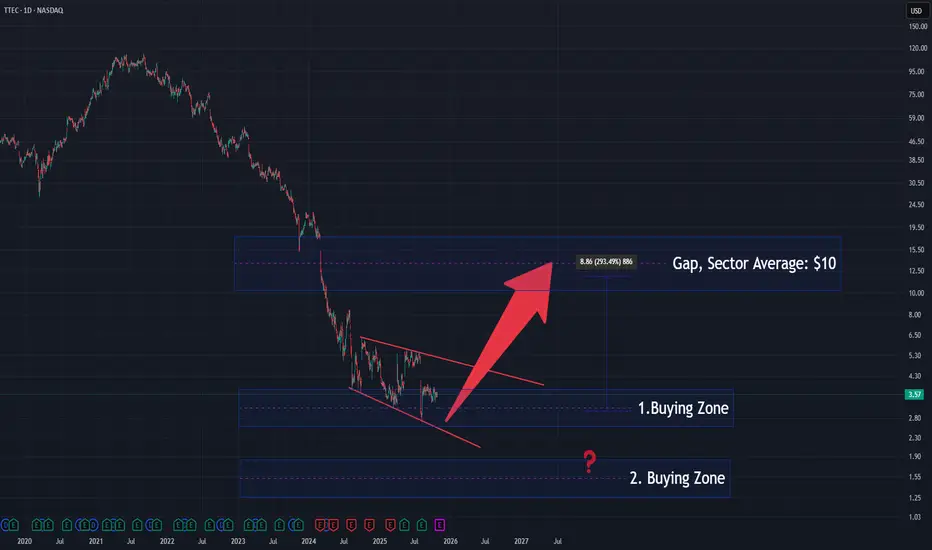
The price structure is forming a descending diagonal, suggesting a potential exhaustion phase of the ongoing downtrend.
The stock is currently trading inside the 1st Buying Zone, with a possible deeper test toward the 2nd Buying Zone before a sustained reversal begins.
The sector average stands near $10, aligning with the gap area, which could act as a major upside target if accumulation continues.
📈 A confirmed breakout from the diagonal pattern would strengthen the bullish bias toward that sector-level equilibrium.
💼 Professional market insights & charts:
cakirinsights.com/
cakirinsights.com/
면책사항
이 정보와 게시물은 TradingView에서 제공하거나 보증하는 금융, 투자, 거래 또는 기타 유형의 조언이나 권고 사항을 의미하거나 구성하지 않습니다. 자세한 내용은 이용 약관을 참고하세요.
💼 Professional market insights & charts:
cakirinsights.com/
cakirinsights.com/
면책사항
이 정보와 게시물은 TradingView에서 제공하거나 보증하는 금융, 투자, 거래 또는 기타 유형의 조언이나 권고 사항을 의미하거나 구성하지 않습니다. 자세한 내용은 이용 약관을 참고하세요.