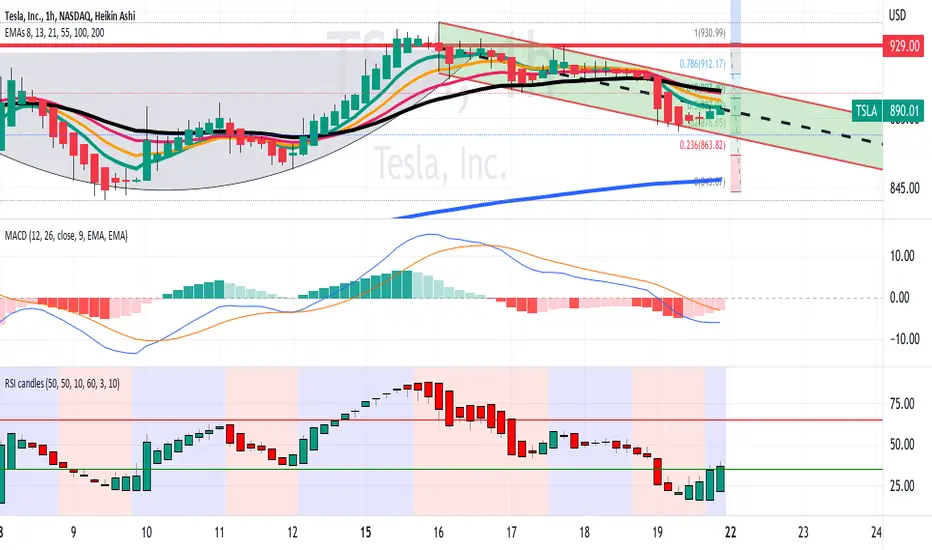
On the 1H timeframe chart, TSLA is showing an early reversal as follows:
(1) It is ascending in a downtrend parallel channel
(2) On the MACD, the signal line is below the histogram, and
the K & D lines are converging on this lagging indicator.
The histogram bars are decreasing in negative height.
(3) the color-coded RSI candle indicator shows bullish engulfing
strength candles.
All in all, I see technical signs of a reversal as described here
면책사항
해당 정보와 게시물은 금융, 투자, 트레이딩 또는 기타 유형의 조언이나 권장 사항으로 간주되지 않으며, 트레이딩뷰에서 제공하거나 보증하는 것이 아닙니다. 자세한 내용은 이용 약관을 참조하세요.
면책사항
해당 정보와 게시물은 금융, 투자, 트레이딩 또는 기타 유형의 조언이나 권장 사항으로 간주되지 않으며, 트레이딩뷰에서 제공하거나 보증하는 것이 아닙니다. 자세한 내용은 이용 약관을 참조하세요.