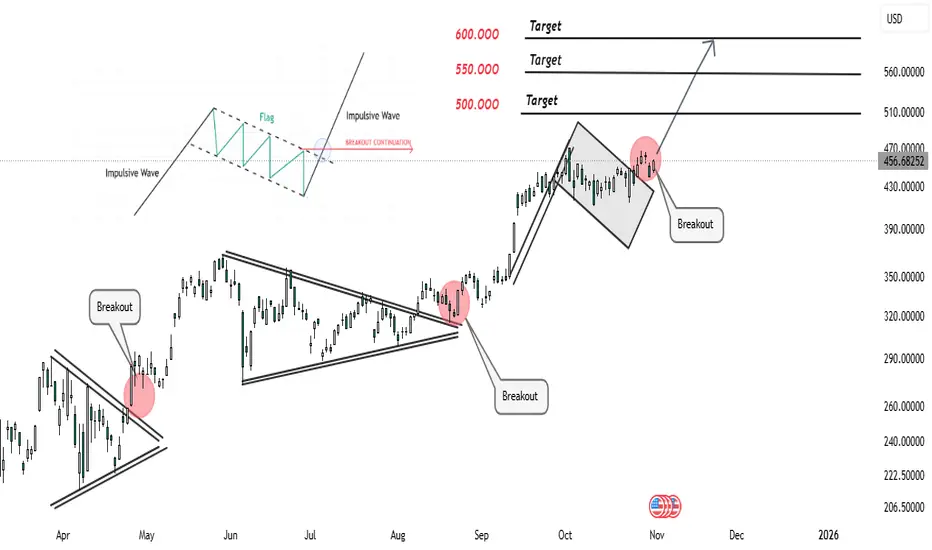
Tesla (TSLA) continues to follow a classic impulsive–corrective wave structure, showing clear signs of bullish continuation.
After each impulsive leg, price forms a consolidation pattern — such as a triangle or flag — allowing the market to gather liquidity before the next breakout.
The recent flag formation represents healthy price compression within a bullish trend, suggesting buyers are still in control.
A confirmed breakout above the flag’s resistance line indicates renewed momentum and potential for another impulsive wave targeting the 500–600 USD range.
From a technical perspective, this structure reflects:
Impulse → Correction → Impulse market rhythm.
Breakouts aligning with volume expansion and momentum continuation.
Higher highs and higher lows, confirming trend strength.
Traders can watch for price stability above the breakout level to confirm continuation. However, failure to hold above that zone may trigger a short-term pullback before the next move up.
🟢 Trend Bias: Bullish continuation
📈 Market Structure: Impulsive–Corrective wave pattern
🎯 Targets: 500 – 550 – 600 USD
📅 Outlook: Medium-term bullish momentum
액티브 트레이드
관련 발행물
면책사항
해당 정보와 게시물은 금융, 투자, 트레이딩 또는 기타 유형의 조언이나 권장 사항으로 간주되지 않으며, 트레이딩뷰에서 제공하거나 보증하는 것이 아닙니다. 자세한 내용은 이용 약관을 참조하세요.
관련 발행물
면책사항
해당 정보와 게시물은 금융, 투자, 트레이딩 또는 기타 유형의 조언이나 권장 사항으로 간주되지 않으며, 트레이딩뷰에서 제공하거나 보증하는 것이 아닙니다. 자세한 내용은 이용 약관을 참조하세요.