🔵 Mastering the Elliott Wave Pattern: Structure, Psychology, and Trading Tips
Difficulty: 🐳🐳🐳🐋🐋 (Intermediate+)
This article is for traders who want to understand the logic behind Elliott Waves — not just memorize patterns. We’ll cover the structure, trader psychology behind each wave, and practical tips for applying it in modern markets.
🔵 INTRODUCTION
The Elliott Wave Theory is one of the oldest and most respected market models. Developed by Ralph Nelson Elliott in the 1930s, it proposes that price doesn’t move randomly — it follows repeating cycles of optimism and pessimism.
At its core, Elliott Wave helps traders see the bigger picture structure of the market. Instead of focusing on one candle or one setup, you learn to read the “story” across multiple waves.
2021 BTC TOP

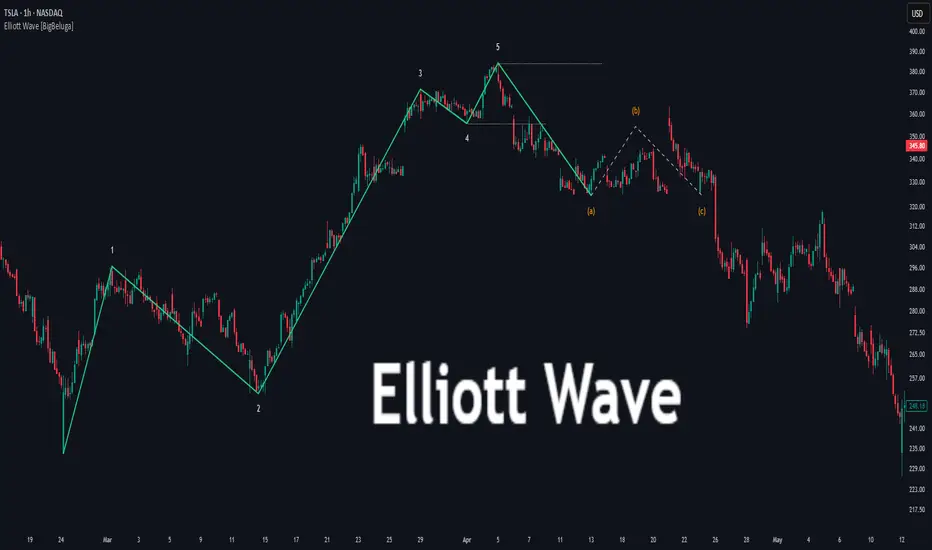
TESLA Stock

🔵 THE BASIC 5-WAVE STRUCTURE
The foundation of Elliott Wave is the Impulse Wave — a 5-wave pattern that moves in the direction of the trend.

🔵 THE CORRECTIVE 3-WAVE STRUCTURE
After the 5-wave impulse comes a 3-wave correction, labeled A-B-C.
Together, the impulse (5) and correction (3) form an 8-wave cycle.

🔵 PSYCHOLOGY BEHIND THE WAVES
Each wave reflects trader psychology:
🔵 TRADING WITH ELLIOTT WAVES
1️⃣ Spot the Trend
Identify whether the market is in an impulse (5-wave) or correction (A-B-C).
2️⃣ Use Fibonacci for Validation
Wave 2 usually retraces 50–61.8-78.6% of Wave 1.

Wave 3 often extends 161.8% of Wave 1.


Wave 5 is often equal to Wave 1.

3️⃣ Trade the Highest-Probability Waves
Wave 3 (trend acceleration) and Wave C (correction completion) are often the cleanest opportunities.

4️⃣ Don’t Force It
Not every market move is Elliott Wave. Use it as a framework, not a rulebook.
🔵 COMMON MISTAKES
🔵 CONCLUSION
The Elliott Wave Theory isn’t about perfection — it’s about perspective. It helps traders understand market cycles, recognize crowd psychology, and anticipate major turning points.
Use Elliott Wave as a map, not a prediction tool. When combined with confluence — volume, liquidity zones, or trend filters — it becomes a powerful edge.
Do you trade with Elliott Waves? Or do you think they’re too subjective? Share your experience below!
Difficulty: 🐳🐳🐳🐋🐋 (Intermediate+)
This article is for traders who want to understand the logic behind Elliott Waves — not just memorize patterns. We’ll cover the structure, trader psychology behind each wave, and practical tips for applying it in modern markets.
🔵 INTRODUCTION
The Elliott Wave Theory is one of the oldest and most respected market models. Developed by Ralph Nelson Elliott in the 1930s, it proposes that price doesn’t move randomly — it follows repeating cycles of optimism and pessimism.
At its core, Elliott Wave helps traders see the bigger picture structure of the market. Instead of focusing on one candle or one setup, you learn to read the “story” across multiple waves.
2021 BTC TOP
TESLA Stock
🔵 THE BASIC 5-WAVE STRUCTURE
The foundation of Elliott Wave is the Impulse Wave — a 5-wave pattern that moves in the direction of the trend.
- Wave 1: The first push, often driven by smart money entering early.
- Wave 2: A correction that shakes out weak hands but doesn’t retrace fully.
- Wave 3: The strongest and longest wave — fueled by mass participation.
- Wave 4: A pause, consolidation, or sideways correction.
- Wave 5: The final push — often weaker, driven by late retail traders.
🔵 THE CORRECTIVE 3-WAVE STRUCTURE
After the 5-wave impulse comes a 3-wave correction, labeled A-B-C.
- Wave A: First countertrend move — often mistaken as a dip.
- Wave B: A false rally — traps late buyers.
- Wave C: A stronger decline (or rally in bearish market), often equal to or longer than Wave A.
Together, the impulse (5) and correction (3) form an 8-wave cycle.
🔵 PSYCHOLOGY BEHIND THE WAVES
Each wave reflects trader psychology:
- Wave 1: Smart money positions quietly.
- Wave 2: Retail doubts the trend — “it’s just a pullback.”
- Wave 3: Mass recognition, everyone piles in.
- Wave 4: Profit-taking and hesitation.
- Wave 5: Final retail FOMO.
- A-B-C: Reality check, trend unwinds before cycle resets.
🔵 TRADING WITH ELLIOTT WAVES
1️⃣ Spot the Trend
Identify whether the market is in an impulse (5-wave) or correction (A-B-C).
2️⃣ Use Fibonacci for Validation
Wave 2 usually retraces 50–61.8-78.6% of Wave 1.
Wave 3 often extends 161.8% of Wave 1.
Wave 5 is often equal to Wave 1.
3️⃣ Trade the Highest-Probability Waves
Wave 3 (trend acceleration) and Wave C (correction completion) are often the cleanest opportunities.
4️⃣ Don’t Force It
Not every market move is Elliott Wave. Use it as a framework, not a rulebook.
🔵 COMMON MISTAKES
- Over-labeling: Trying to force waves where they don’t exist.
- Ignoring timeframes: Waves may look different across scales.
- Trading every wave: Not all waves are high-probability setups.
🔵 CONCLUSION
The Elliott Wave Theory isn’t about perfection — it’s about perspective. It helps traders understand market cycles, recognize crowd psychology, and anticipate major turning points.
Use Elliott Wave as a map, not a prediction tool. When combined with confluence — volume, liquidity zones, or trend filters — it becomes a powerful edge.
Do you trade with Elliott Waves? Or do you think they’re too subjective? Share your experience below!
🔵Gain access to our powerful tools : bigbeluga.com/tv
🔵Join our free discord for updates : bigbeluga.com/discord
All scripts & content provided by BigBeluga are for informational & educational purposes only.
🔵Join our free discord for updates : bigbeluga.com/discord
All scripts & content provided by BigBeluga are for informational & educational purposes only.
관련 발행물
면책사항
해당 정보와 게시물은 금융, 투자, 트레이딩 또는 기타 유형의 조언이나 권장 사항으로 간주되지 않으며, 트레이딩뷰에서 제공하거나 보증하는 것이 아닙니다. 자세한 내용은 이용 약관을 참조하세요.