📊 TSLA Technical Analysis (Daily Timeframe)
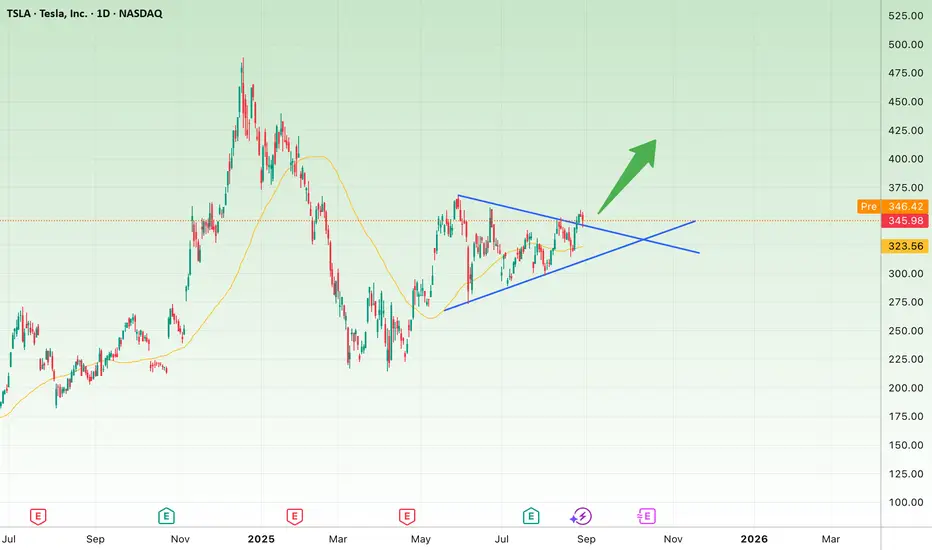
After a period of consolidation inside a Symmetrical Triangle, Tesla’s price is now showing a potential breakout to the upside. This could be an early signal for the beginning of a new bullish wave.
🔹 Key Support: $323 – $325
🔹 Next Resistances: $375 and, if broken, higher targets at $400 – $420
The 50-day moving average is currently supporting the uptrend, and a confirmed close above the $346 level would strengthen the bullish outlook.
⚠️ However, if the price fails and breaks below $323, the bullish scenario may lose validity and a corrective move could follow.
면책사항
해당 정보와 게시물은 금융, 투자, 트레이딩 또는 기타 유형의 조언이나 권장 사항으로 간주되지 않으며, 트레이딩뷰에서 제공하거나 보증하는 것이 아닙니다. 자세한 내용은 이용 약관을 참조하세요.
면책사항
해당 정보와 게시물은 금융, 투자, 트레이딩 또는 기타 유형의 조언이나 권장 사항으로 간주되지 않으며, 트레이딩뷰에서 제공하거나 보증하는 것이 아닙니다. 자세한 내용은 이용 약관을 참조하세요.