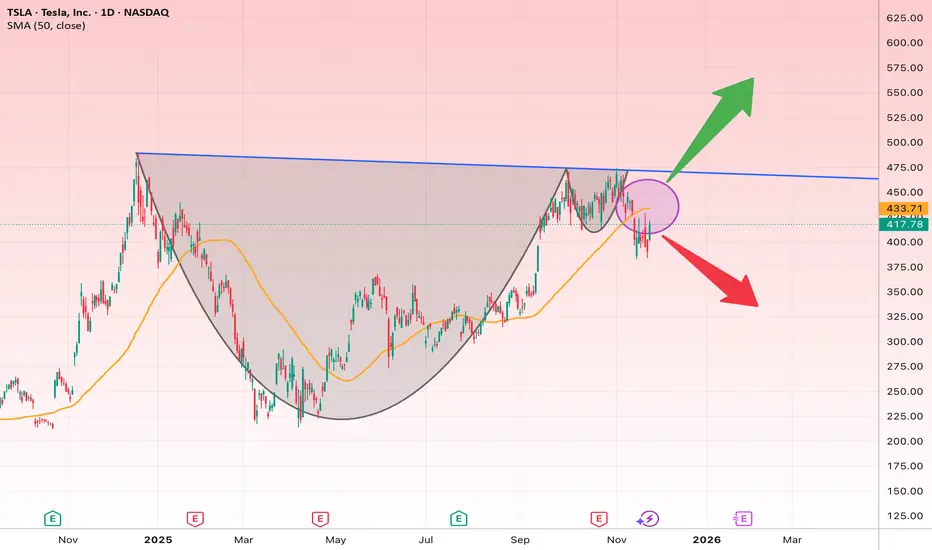
The chart shows a clear Cup & Handle pattern forming on the daily timeframe. Price touched the descending resistance (blue line) and failed to break out, placing TSLA at a critical decision point.
Key Points:
• Main Resistance: 450–465 zone (descending trendline + neckline of pattern)
• Major Support: 395–400 zone
• The 50-day MA is currently acting as near-term resistance.
Bullish Scenario (If price breaks above 465)
A breakout with a daily close above 465 would likely trigger:
• Target 1: $500
• Target 2: $545
• Target 3: $600
Bearish Scenario (If 395 breaks)
A breakdown below 395 may lead to:
• Bearish Target 1: $360
• Target 2: $325
Suggested Stop-Loss:
• $394 (for long positions)
면책사항
해당 정보와 게시물은 금융, 투자, 트레이딩 또는 기타 유형의 조언이나 권장 사항으로 간주되지 않으며, 트레이딩뷰에서 제공하거나 보증하는 것이 아닙니다. 자세한 내용은 이용 약관을 참조하세요.
면책사항
해당 정보와 게시물은 금융, 투자, 트레이딩 또는 기타 유형의 조언이나 권장 사항으로 간주되지 않으며, 트레이딩뷰에서 제공하거나 보증하는 것이 아닙니다. 자세한 내용은 이용 약관을 참조하세요.