This is a follow-up to my August–October technical outlook on Tesla ( TSLA).
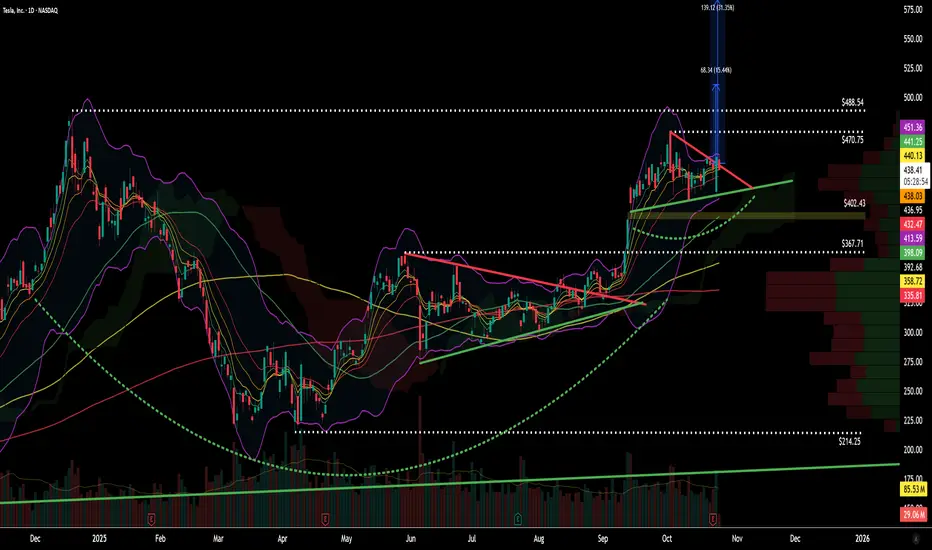
After the first bull pennant breakout, price pushed to $470, falling just shy of my initial $480 target, before pausing and forming another bull pennant directly below December’s all-time high near $488.
Structure & Momentum
Momentum remains strong — the daily chart has now completed a cup and handle formation, adding a new layer of continuation confluence to the broader trend structure.
The key takeaway here is thatTSLA continues to respect rising MAs and trendline support, consolidating at high levels rather than breaking down — a bullish sign of controlled digestion after a strong run.
To confirm a full breakout continuation, the chart now needs a decisive move through $488 on high volume. Until that happens, the current pennant acts as both a compression zone and accumulation phase.
Breakout & Targets
If volume expands andTSLA clears the $488 ATH, the next resistance targets are:
Target 1: $510 → symmetrical triangle 1:1 projection
Target 2: $580 → measured move from flagpole #2 (pennant #1 extension)
Both levels represent high-probability reaction zones where price could pause or retrace before resuming trend.
Support & Risk Management
Below, the chart shows clear structural support at:
$402 → prior breakout base and Ichimoku cloud zone
$367–$370 → trendline & confluence support
As long as price respects these zones, the setup remains valid and constructive.
A close below $370 on strong volume would invalidate the near-term bullish bias.
Technical Summary
✅ Trend: Bullish continuation
✅ Pattern: Cup & Handle + Bull Pennant #2
📊 Key Resistance: $488 (ATH)
🎯 Targets: $510 / $580
⚠️ Support Watch: $402 → $370
🔍 Trigger: Breakout confirmation on strong volume
Final Notes
Tesla continues to show a textbook multi-phase breakout structure — bull pennant, consolidation, and potential measured-move continuation. Until the breakout confirms, patience around $488 remains key. Once volume supports it, the next leg higher could complete the second flagpole move toward the $510–$580 range.
For educational and technical analysis purposes only.
After the first bull pennant breakout, price pushed to $470, falling just shy of my initial $480 target, before pausing and forming another bull pennant directly below December’s all-time high near $488.
Structure & Momentum
Momentum remains strong — the daily chart has now completed a cup and handle formation, adding a new layer of continuation confluence to the broader trend structure.
The key takeaway here is that
To confirm a full breakout continuation, the chart now needs a decisive move through $488 on high volume. Until that happens, the current pennant acts as both a compression zone and accumulation phase.
Breakout & Targets
If volume expands and
Target 1: $510 → symmetrical triangle 1:1 projection
Target 2: $580 → measured move from flagpole #2 (pennant #1 extension)
Both levels represent high-probability reaction zones where price could pause or retrace before resuming trend.
Support & Risk Management
Below, the chart shows clear structural support at:
$402 → prior breakout base and Ichimoku cloud zone
$367–$370 → trendline & confluence support
As long as price respects these zones, the setup remains valid and constructive.
A close below $370 on strong volume would invalidate the near-term bullish bias.
Technical Summary
✅ Trend: Bullish continuation
✅ Pattern: Cup & Handle + Bull Pennant #2
📊 Key Resistance: $488 (ATH)
🎯 Targets: $510 / $580
⚠️ Support Watch: $402 → $370
🔍 Trigger: Breakout confirmation on strong volume
Final Notes
Tesla continues to show a textbook multi-phase breakout structure — bull pennant, consolidation, and potential measured-move continuation. Until the breakout confirms, patience around $488 remains key. Once volume supports it, the next leg higher could complete the second flagpole move toward the $510–$580 range.
For educational and technical analysis purposes only.
면책사항
해당 정보와 게시물은 금융, 투자, 트레이딩 또는 기타 유형의 조언이나 권장 사항으로 간주되지 않으며, 트레이딩뷰에서 제공하거나 보증하는 것이 아닙니다. 자세한 내용은 이용 약관을 참조하세요.
면책사항
해당 정보와 게시물은 금융, 투자, 트레이딩 또는 기타 유형의 조언이나 권장 사항으로 간주되지 않으며, 트레이딩뷰에서 제공하거나 보증하는 것이 아닙니다. 자세한 내용은 이용 약관을 참조하세요.