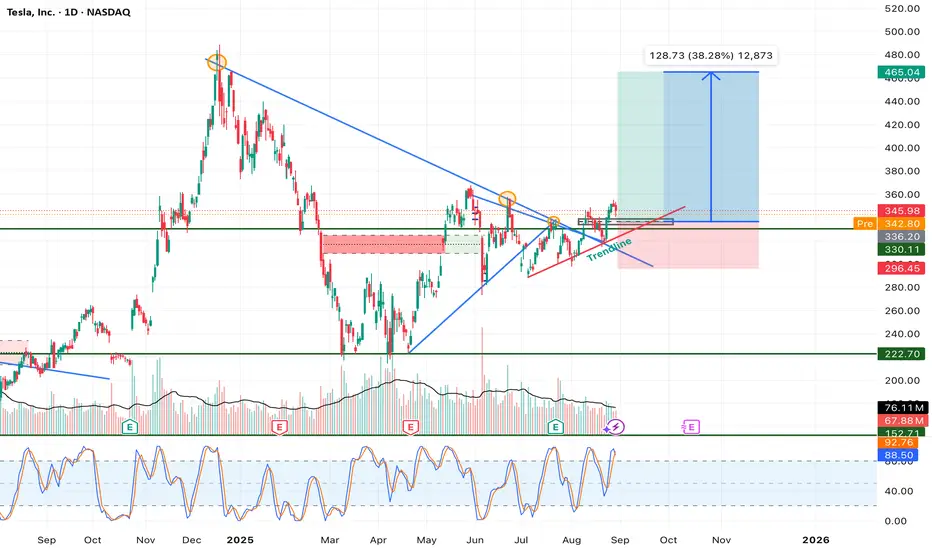
Tesla (TSLA) has been consolidating for several months within a symmetrical triangle formation, bounded by a descending resistance trendline from the November 2024 high and an ascending support trendline from the April 2025 low. This consolidation has now resolved with a breakout above resistance, suggesting the start of a new bullish leg.
Technical Breakdown:
1. Symmetrical Triangle Formation:
• Price compressed into tighter ranges, with lower highs and higher lows converging.
• Breakout occurred above the descending trendline, confirming bullish bias.
2. Volume Confirmation:
• Breakout was accompanied by a noticeable uptick in buying volume, strengthening the validity of the move.
• Historical patterns show Tesla often rallies strongly after high-volume breakouts from consolidation zones.
3. Support & Resistance Zones:
• Immediate support: $336 (former resistance turned support, aligned with trendline retest).
• Stronger support: $296 (previous demand zone, key invalidation level).
• Resistance target: $465 (measured move from triangle breakout, aligning with prior swing levels).
4. Momentum Indicators:
• Stochastic RSI is rebounding from oversold territory, suggesting fresh buying momentum.
• MACD (not shown on chart but implied) likely supports bullish crossover given recent price action.
5. Risk-to-Reward Setup:
• Entry: $340–$345 zone after breakout retest.
• Stop Loss: Below $296 (breakdown invalidation).
• Target: $465 (38% upside potential from current levels).
• Risk/reward ratio favors long positions with significant asymmetry.
Trade Thesis:
The breakout from a well-defined symmetrical triangle suggests a continuation of Tesla’s mid-term bullish trend. The measured move projection points toward ~$465, representing a potential 38% rally from current prices. As long as price sustains above the $336–$340 support zone, bulls remain in control. A breakdown below $296 would invalidate this structure and open the door for a deeper retracement.
Conclusion:
Tesla has entered a critical bullish phase after months of consolidation. With volume confirmation, favorable risk-to-reward, and momentum recovery, the path of least resistance is higher. Upside targets sit near $465, with invalidation set at $296.
 TSLA
TSLA
Technical Breakdown:
1. Symmetrical Triangle Formation:
• Price compressed into tighter ranges, with lower highs and higher lows converging.
• Breakout occurred above the descending trendline, confirming bullish bias.
2. Volume Confirmation:
• Breakout was accompanied by a noticeable uptick in buying volume, strengthening the validity of the move.
• Historical patterns show Tesla often rallies strongly after high-volume breakouts from consolidation zones.
3. Support & Resistance Zones:
• Immediate support: $336 (former resistance turned support, aligned with trendline retest).
• Stronger support: $296 (previous demand zone, key invalidation level).
• Resistance target: $465 (measured move from triangle breakout, aligning with prior swing levels).
4. Momentum Indicators:
• Stochastic RSI is rebounding from oversold territory, suggesting fresh buying momentum.
• MACD (not shown on chart but implied) likely supports bullish crossover given recent price action.
5. Risk-to-Reward Setup:
• Entry: $340–$345 zone after breakout retest.
• Stop Loss: Below $296 (breakdown invalidation).
• Target: $465 (38% upside potential from current levels).
• Risk/reward ratio favors long positions with significant asymmetry.
Trade Thesis:
The breakout from a well-defined symmetrical triangle suggests a continuation of Tesla’s mid-term bullish trend. The measured move projection points toward ~$465, representing a potential 38% rally from current prices. As long as price sustains above the $336–$340 support zone, bulls remain in control. A breakdown below $296 would invalidate this structure and open the door for a deeper retracement.
Conclusion:
Tesla has entered a critical bullish phase after months of consolidation. With volume confirmation, favorable risk-to-reward, and momentum recovery, the path of least resistance is higher. Upside targets sit near $465, with invalidation set at $296.
면책사항
해당 정보와 게시물은 금융, 투자, 트레이딩 또는 기타 유형의 조언이나 권장 사항으로 간주되지 않으며, 트레이딩뷰에서 제공하거나 보증하는 것이 아닙니다. 자세한 내용은 이용 약관을 참조하세요.
면책사항
해당 정보와 게시물은 금융, 투자, 트레이딩 또는 기타 유형의 조언이나 권장 사항으로 간주되지 않으며, 트레이딩뷰에서 제공하거나 보증하는 것이 아닙니다. 자세한 내용은 이용 약관을 참조하세요.