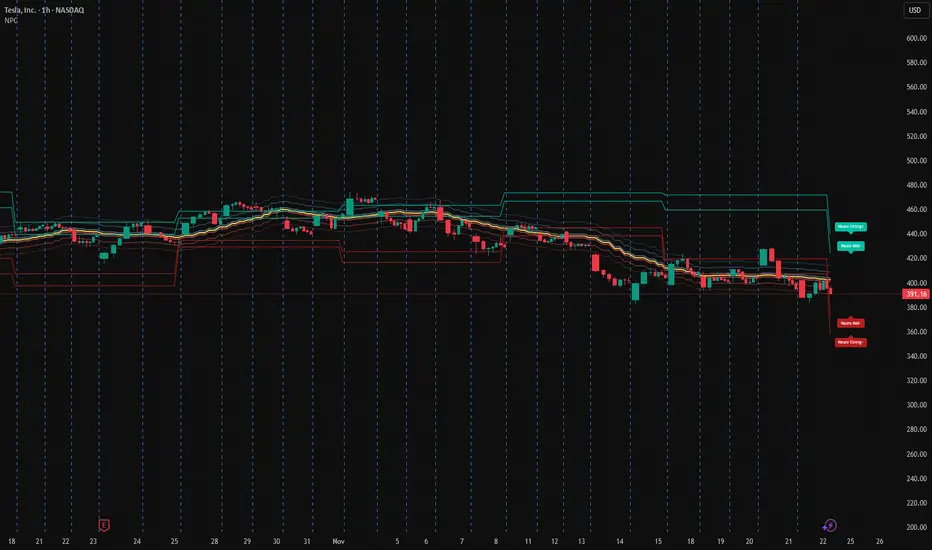
Tesla is currently trading inside a NPC post-distribution compression range after breaking down from the upper volatility structure.
Instead of predicting direction, here’s the statistical positioning based on the NeuroPolynomial Channel:
Current Positioning:
• Price under NPC Core Cluster
• Distance to lower stress band: ~1.4%
• Distance to upper expansion band: ~3.2%
• Compression vs prior impulse: ~0.61
NPC Volatility Map:
• Upper Expansion Zone: +3% to +3.8%
• Core Equilibrium: 400–412 zone
• Lower Rejection Band: −1.4%
• Breakdown Continuation Zone: −2.8% to −3.5%
Interpretation (scenario-based):
– Sustained acceptance above core → structural rebuild attempt
– Rejection at core → continuation inside stress band
– Re-entry into strong-lower → extension zone unlock
This is a volatility structure map, not a prediction model.
AI-driven market structure analysis.
면책사항
해당 정보와 게시물은 금융, 투자, 트레이딩 또는 기타 유형의 조언이나 권장 사항으로 간주되지 않으며, 트레이딩뷰에서 제공하거나 보증하는 것이 아닙니다. 자세한 내용은 이용 약관을 참조하세요.
AI-driven market structure analysis.
면책사항
해당 정보와 게시물은 금융, 투자, 트레이딩 또는 기타 유형의 조언이나 권장 사항으로 간주되지 않으며, 트레이딩뷰에서 제공하거나 보증하는 것이 아닙니다. 자세한 내용은 이용 약관을 참조하세요.