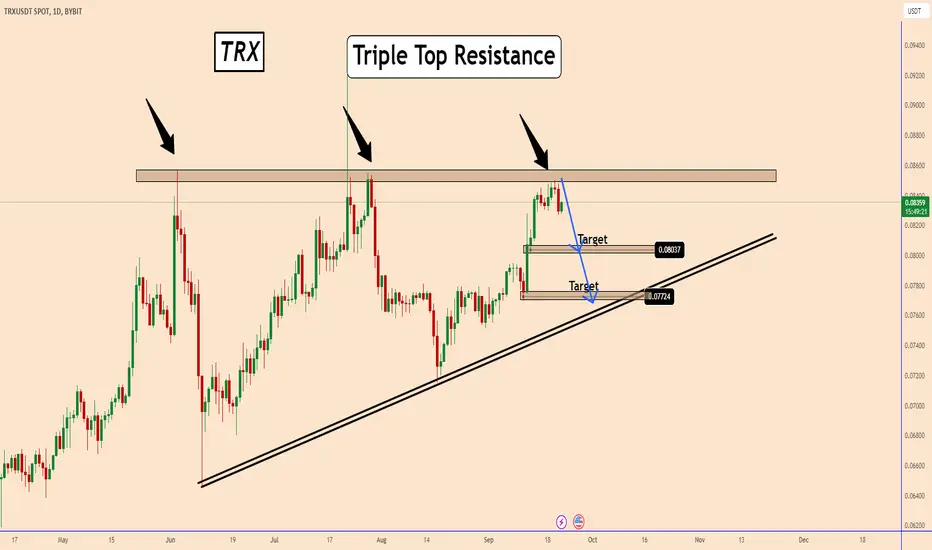
📣#TRX -Triple Top within a daily triangle
ON the daily chart the price is testing a strong key resistance
zone located near 0.08600.
The price reacted two times in that area and the chances
are higher for a bearish wave again.
A sell near 0.0840-0.0845 can give us better trading
opportunities with targets 0.0800 and 0.0770
Thank you and Good Luck!
✅MY FREE Signals Channel
t.me/TradingPuzzles
✅Personal Telegram
t.me/KlejdiCuni
✅Suggested News Channel
t.me/ForexNewsNavigator_Official
t.me/TradingPuzzles
✅Personal Telegram
t.me/KlejdiCuni
✅Suggested News Channel
t.me/ForexNewsNavigator_Official
면책사항
이 정보와 게시물은 TradingView에서 제공하거나 보증하는 금융, 투자, 거래 또는 기타 유형의 조언이나 권고 사항을 의미하거나 구성하지 않습니다. 자세한 내용은 이용 약관을 참고하세요.