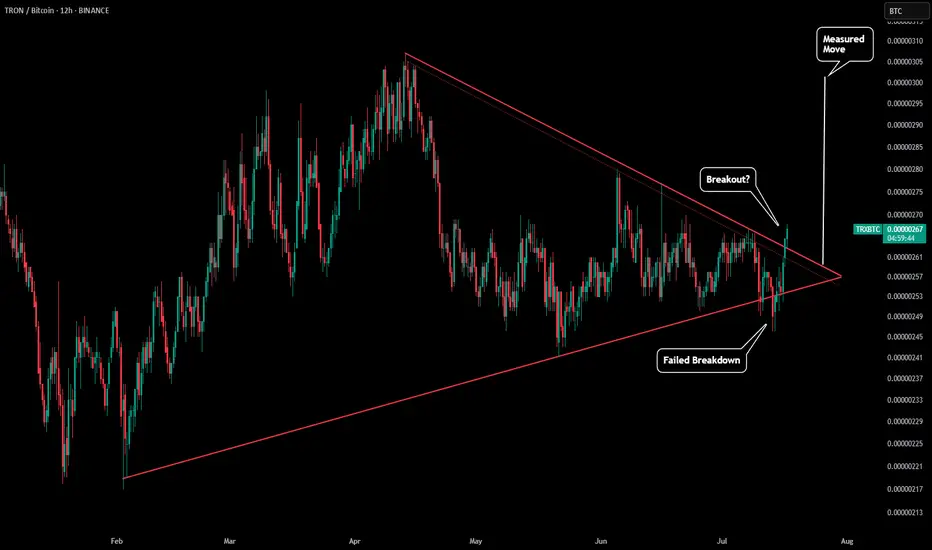
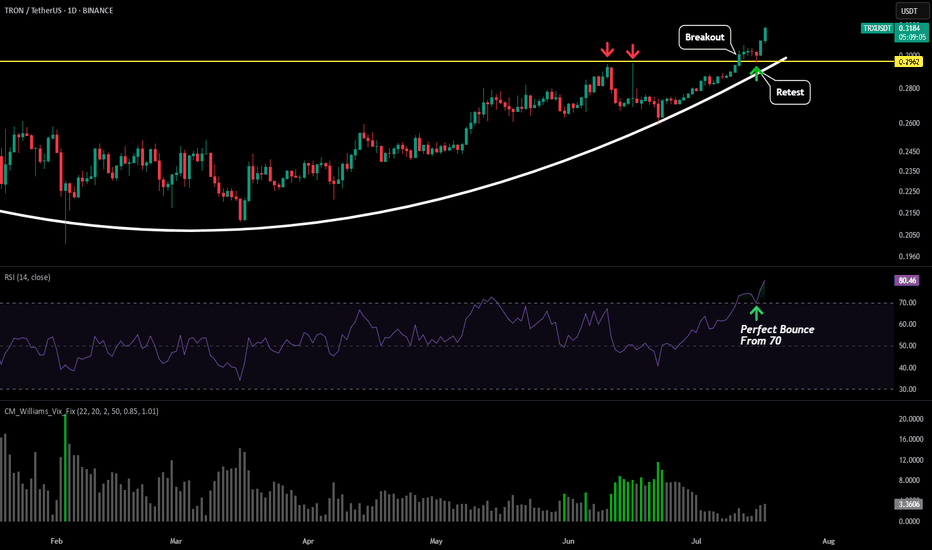
We have already seen the TRX/USD chart breakout (as seen in our previous post), but now the BTC pair is trying to breakout to.
On the daily chart we are trying to get above our downwards sloping red resistance line. It is possible we retest, but if this breakout continue that could push the BTC pair to above $0.000003 +. This is inline with our measured move (white line) and also where the symmetrical triangle started.
On the daily chart we are trying to get above our downwards sloping red resistance line. It is possible we retest, but if this breakout continue that could push the BTC pair to above $0.000003 +. This is inline with our measured move (white line) and also where the symmetrical triangle started.
면책사항
이 정보와 게시물은 TradingView에서 제공하거나 보증하는 금융, 투자, 거래 또는 기타 유형의 조언이나 권고 사항을 의미하거나 구성하지 않습니다. 자세한 내용은 이용 약관을 참고하세요.
면책사항
이 정보와 게시물은 TradingView에서 제공하거나 보증하는 금융, 투자, 거래 또는 기타 유형의 조언이나 권고 사항을 의미하거나 구성하지 않습니다. 자세한 내용은 이용 약관을 참고하세요.