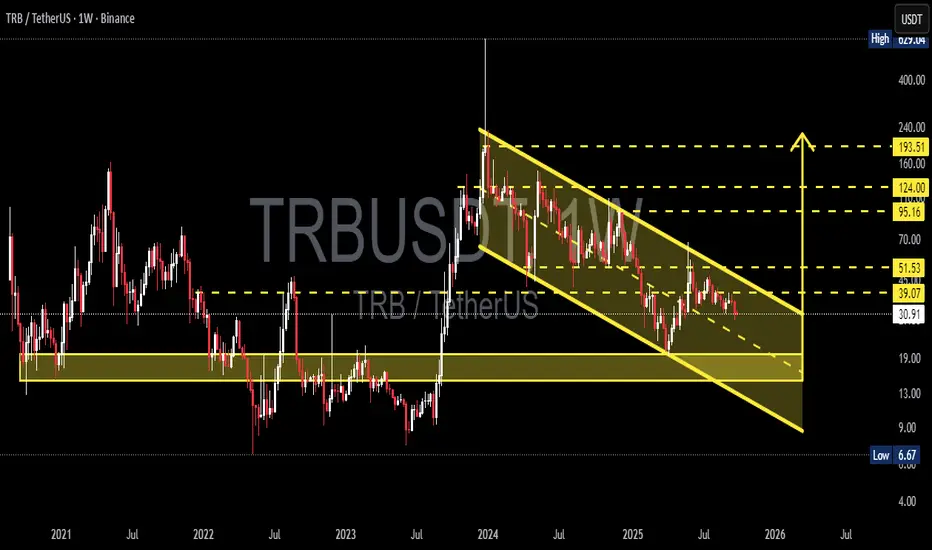
TRB (Tellor) is now entering a crucial phase. After the massive rally in 2024, the market has pushed TRB into a structured correction forming a clear descending channel on the weekly timeframe. This chart reflects the ongoing battle between long-term accumulation and medium-term selling pressure.
---
🔎 Technical Structure
1. Descending Channel (Bearish Structure):
Price continues to form lower highs & lower lows, confirming sellers remain dominant.
The channel can act either as a distribution phase before further breakdown, or a long-term accumulation phase before reversal.
2. Historical Support Zone (13 – 19 USDT):
This area has served as a major turning point multiple times since 2021.
A breakdown below this level could trigger a capitulation move toward the channel bottom near 9 USDT.
3. Key Resistance (39 – 51 USDT):
This is the “first gateway” for bullish validation.
A strong breakout here with volume could unlock a rally toward 95 – 124 USDT.
4. Fibonacci / Historical Levels:
95.16 → Strong psychological resistance.
124.00 → Potential major profit-taking zone.
193.51 → Long-term target if a full bullish trend resumes.
---
🚀 Bullish Scenario (Potential Reversal)
Confirmation: Weekly close above the descending channel with a successful retest.
Targets (Stage 1): 39.07 → 51.53.
Targets (Stage 2): 95.16 → 124.00.
Narrative: A breakout from the channel signals the end of the long correction, opening the door for buyers to step in aggressively above 51 USDT.
---
📉 Bearish Scenario (Continuation)
Confirmation: Strong rejection at the channel upper boundary + breakdown below 30 USDT.
Targets (Stage 1): 19 USDT (minor support).
Targets (Stage 2): 13 USDT → 9 USDT (channel bottom).
Narrative: As long as price remains within the channel, bearish sentiment dominates. A breakdown of historical support means a potential capitulation before the next accumulation cycle.
---
🧭 Trading Strategy
Conservative Traders: Wait for a weekly breakout + retest before going long (low risk – high reward).
Aggressive Traders: Scale into the 13 – 19 zone with tight stops below 13.
Short Traders: Look for rejection at the upper/midline channel for swing shorts targeting support zones.
Risk Management: TRB is highly volatile (as seen in 2024) — always cap risk at 1–3% per position.
---
📌 Conclusion
TRB is at a major crossroads. While the descending channel still favors the bearish trend, a confirmed breakout would be a game-changer, signaling the end of correction and opening the way toward 95–124 USDT. On the flip side, failure to hold above 30 could drag price back to 13–19 or even 9 USDT.
This setup is not just about chart patterns, but also about market psychology: Is TRB ready for long-term accumulation, or is one more leg down still ahead?
---
#TRB #TRBUSDT #Crypto #Altcoin #PriceAction #TechnicalAnalysis #DescendingChannel #Breakout #SwingTrading #SupportResistance
---
🔎 Technical Structure
1. Descending Channel (Bearish Structure):
Price continues to form lower highs & lower lows, confirming sellers remain dominant.
The channel can act either as a distribution phase before further breakdown, or a long-term accumulation phase before reversal.
2. Historical Support Zone (13 – 19 USDT):
This area has served as a major turning point multiple times since 2021.
A breakdown below this level could trigger a capitulation move toward the channel bottom near 9 USDT.
3. Key Resistance (39 – 51 USDT):
This is the “first gateway” for bullish validation.
A strong breakout here with volume could unlock a rally toward 95 – 124 USDT.
4. Fibonacci / Historical Levels:
95.16 → Strong psychological resistance.
124.00 → Potential major profit-taking zone.
193.51 → Long-term target if a full bullish trend resumes.
---
🚀 Bullish Scenario (Potential Reversal)
Confirmation: Weekly close above the descending channel with a successful retest.
Targets (Stage 1): 39.07 → 51.53.
Targets (Stage 2): 95.16 → 124.00.
Narrative: A breakout from the channel signals the end of the long correction, opening the door for buyers to step in aggressively above 51 USDT.
---
📉 Bearish Scenario (Continuation)
Confirmation: Strong rejection at the channel upper boundary + breakdown below 30 USDT.
Targets (Stage 1): 19 USDT (minor support).
Targets (Stage 2): 13 USDT → 9 USDT (channel bottom).
Narrative: As long as price remains within the channel, bearish sentiment dominates. A breakdown of historical support means a potential capitulation before the next accumulation cycle.
---
🧭 Trading Strategy
Conservative Traders: Wait for a weekly breakout + retest before going long (low risk – high reward).
Aggressive Traders: Scale into the 13 – 19 zone with tight stops below 13.
Short Traders: Look for rejection at the upper/midline channel for swing shorts targeting support zones.
Risk Management: TRB is highly volatile (as seen in 2024) — always cap risk at 1–3% per position.
---
📌 Conclusion
TRB is at a major crossroads. While the descending channel still favors the bearish trend, a confirmed breakout would be a game-changer, signaling the end of correction and opening the way toward 95–124 USDT. On the flip side, failure to hold above 30 could drag price back to 13–19 or even 9 USDT.
This setup is not just about chart patterns, but also about market psychology: Is TRB ready for long-term accumulation, or is one more leg down still ahead?
---
#TRB #TRBUSDT #Crypto #Altcoin #PriceAction #TechnicalAnalysis #DescendingChannel #Breakout #SwingTrading #SupportResistance
✅ Get Free Signals! Join Our Telegram Channel Here: t.me/TheCryptoNuclear
✅ Twitter: twitter.com/crypto_nuclear
✅ Join Bybit : partner.bybit.com/b/nuclearvip
✅ Benefits : Lifetime Trading Fee Discount -50%
✅ Twitter: twitter.com/crypto_nuclear
✅ Join Bybit : partner.bybit.com/b/nuclearvip
✅ Benefits : Lifetime Trading Fee Discount -50%
면책사항
이 정보와 게시물은 TradingView에서 제공하거나 보증하는 금융, 투자, 거래 또는 기타 유형의 조언이나 권고 사항을 의미하거나 구성하지 않습니다. 자세한 내용은 이용 약관을 참고하세요.