Toast Inc. is a cloud-based platform providing restaurant management software, including POS systems, payments, and operations tools. It's a growth stock in fintech/SaaS, benefiting from restaurant digitization but volatile with economic sensitivity to hospitality spending.
Recent Performance & Fundamentals:
Current Price: $34.98 (as of Oct 10, 2025 close, down 5.10% on the day with 6.88% intraday fluctuation).
Market Cap: $18.8B.
52-Week Range: ~$20–$60 (trading mid-range after YTD volatility).
Key Metrics: Trailing P/E 92.64, EPS (TTM) $0.39 (up 223% YoY on strong growth). Forward P/E 29.85; Q3 earnings due Nov 6.
News/Outlook: Recent survey highlights industry adoption, but shares dipped on broader market rotation; EPS growth and revenue ramps support 2025 optimism.
Buy, Hold, or Sell?
Strong Buy. Analyst consensus is Overweight/Buy (29 ratings), with average price target $50.30 (~44% upside from here), high $60, low $36. Ideal entry on dip for growth portfolios, but watch consumer spending.
Technical Areas to Watch:
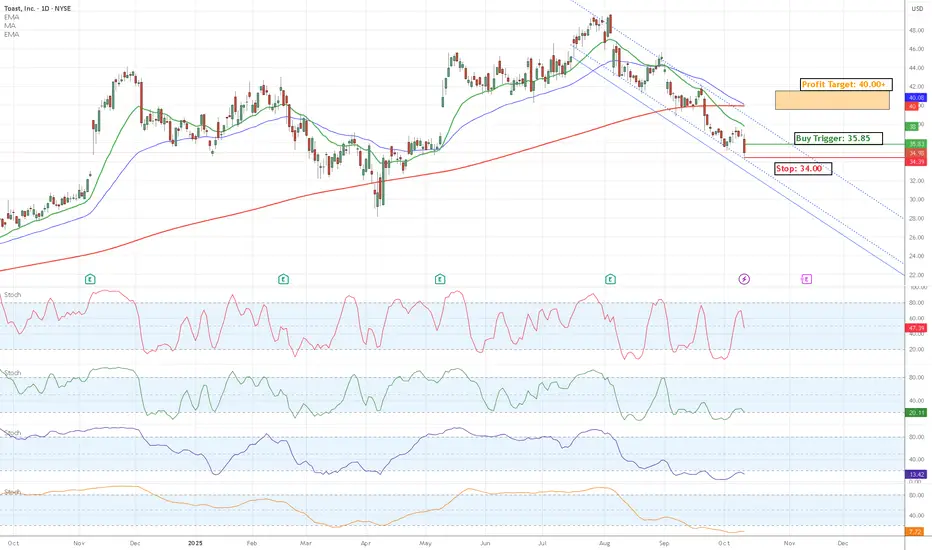
Short-term bearish/oversold (overall Sell signal), potential rebound setup. Key levels:
Support: $34.00 (recent low; break eyes $30 psychological).
Resistance: $36.00 (prior close; clear for $40 50-day MA).
Key Indicators:
RSI (14): 30.41 (oversold—watch bounce >40).
MACD: -0.29 (bearish, but divergence possible).
MAs: Below 200-day ~$39.91 (Sell); volume up on dip.
Recent Performance & Fundamentals:
Current Price: $34.98 (as of Oct 10, 2025 close, down 5.10% on the day with 6.88% intraday fluctuation).
Market Cap: $18.8B.
52-Week Range: ~$20–$60 (trading mid-range after YTD volatility).
Key Metrics: Trailing P/E 92.64, EPS (TTM) $0.39 (up 223% YoY on strong growth). Forward P/E 29.85; Q3 earnings due Nov 6.
News/Outlook: Recent survey highlights industry adoption, but shares dipped on broader market rotation; EPS growth and revenue ramps support 2025 optimism.
Buy, Hold, or Sell?
Strong Buy. Analyst consensus is Overweight/Buy (29 ratings), with average price target $50.30 (~44% upside from here), high $60, low $36. Ideal entry on dip for growth portfolios, but watch consumer spending.
Technical Areas to Watch:
Short-term bearish/oversold (overall Sell signal), potential rebound setup. Key levels:
Support: $34.00 (recent low; break eyes $30 psychological).
Resistance: $36.00 (prior close; clear for $40 50-day MA).
Key Indicators:
RSI (14): 30.41 (oversold—watch bounce >40).
MACD: -0.29 (bearish, but divergence possible).
MAs: Below 200-day ~$39.91 (Sell); volume up on dip.
면책사항
해당 정보와 게시물은 금융, 투자, 트레이딩 또는 기타 유형의 조언이나 권장 사항으로 간주되지 않으며, 트레이딩뷰에서 제공하거나 보증하는 것이 아닙니다. 자세한 내용은 이용 약관을 참조하세요.
면책사항
해당 정보와 게시물은 금융, 투자, 트레이딩 또는 기타 유형의 조언이나 권장 사항으로 간주되지 않으며, 트레이딩뷰에서 제공하거나 보증하는 것이 아닙니다. 자세한 내용은 이용 약관을 참조하세요.