📊 Technical Breakdown:
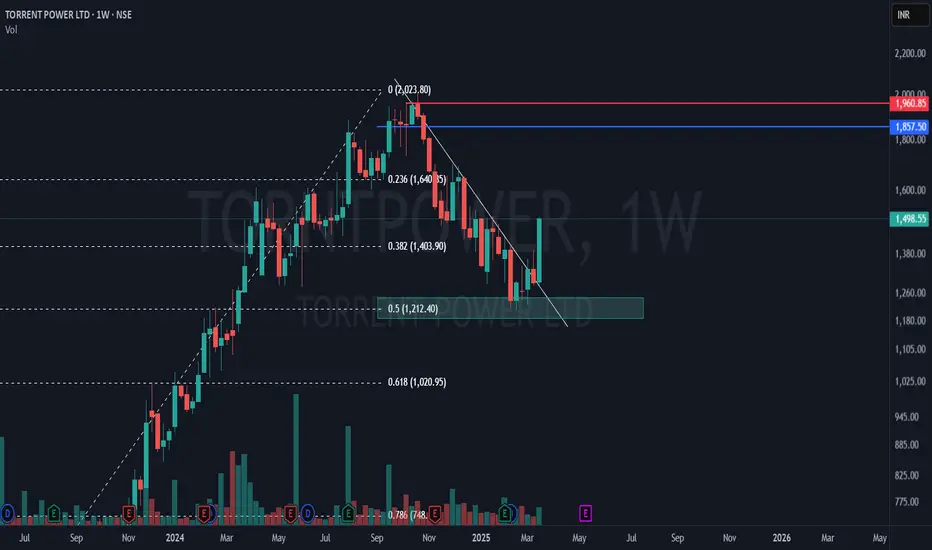
🔹 50% Fibonacci Retracement at ₹1,212 – a crucial support where buyers stepped in!
🔹 Falling trendline breakout with a massive +16.06% green candle – trend reversal confirmation?
🔹 Volume surge suggests strong buying interest but relatively still lower than as it used to be in this stock year ago
🔹 Blue and Red lines are nearest supply zone created by a weekly and monthly time frame
🎯 Master My Self-Made Trading Strategy
📈 Telegram (Learn Today): t.me/hashtaghammer
✅ WhatsApp (Learn Today): wa.me/919455664601
📈 Telegram (Learn Today): t.me/hashtaghammer
✅ WhatsApp (Learn Today): wa.me/919455664601
관련 발행물
면책사항
해당 정보와 게시물은 금융, 투자, 트레이딩 또는 기타 유형의 조언이나 권장 사항으로 간주되지 않으며, 트레이딩뷰에서 제공하거나 보증하는 것이 아닙니다. 자세한 내용은 이용 약관을 참조하세요.