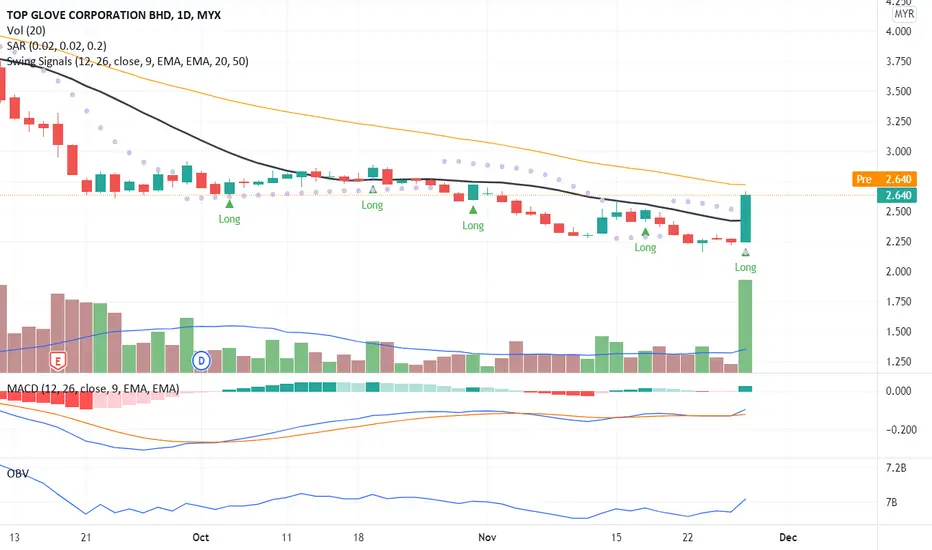
Significant price movement due to buying interest makes the candlestick close above MA20. Hence, creating a price breakout signal with big volumes confirmed the trend after side-way for several trades.
MACD and OBV charts indicate a divergence signal. Therefore, the a high possibility of a long trade position. Will TOPGLOV will be having a price correction or continue the price up momentum?
To place your bid, use VWAP as a guideline and place your bid below the VWAP line.
Put TOPGLOV in your WL and watch out for price rally-up momentum.
R 2.72
S 2.24
관련 발행물
면책사항
해당 정보와 게시물은 금융, 투자, 트레이딩 또는 기타 유형의 조언이나 권장 사항으로 간주되지 않으며, 트레이딩뷰에서 제공하거나 보증하는 것이 아닙니다. 자세한 내용은 이용 약관을 참조하세요.
면책사항
해당 정보와 게시물은 금융, 투자, 트레이딩 또는 기타 유형의 조언이나 권장 사항으로 간주되지 않으며, 트레이딩뷰에서 제공하거나 보증하는 것이 아닙니다. 자세한 내용은 이용 약관을 참조하세요.