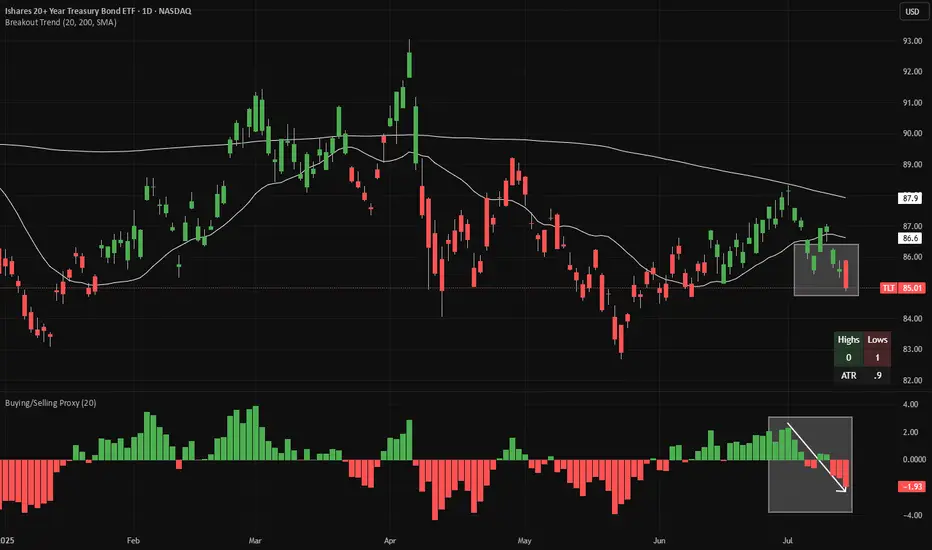
TLT is making 20-day lows (red candles in the main chart), while continuing to make 20-week lows on a weekly chart (not shown). Meanwhile, looking at a proxy of net buying/selling (bottom panel), we have flipped from buying to selling.
Looking at Japanese bond yields, 10-year JGBs (JP10Y) just broke out of tight range. This is the third attempt to trade above ~1.59% recently, which we saw earlier today. As Japan's is one of the world's leading overseas investors, this is an obvious warning sign for bonds globally.
There is good risk/reward to short bonds here, with a stop-loss if the price closes at a 20-day high. If a 20-day high is made, the candles will change color from red to green.
Both indicators (Breakout Trend and Buying/Selling Proxy) are available for free on TradingView.
거래청산: 스탑 닿음
Worth taking the loss here. Selling has likely climaxed, and long-duration bonds are now more likely to follow medium- and short-duration bonds higher.
면책사항
이 정보와 게시물은 TradingView에서 제공하거나 보증하는 금융, 투자, 거래 또는 기타 유형의 조언이나 권고 사항을 의미하거나 구성하지 않습니다. 자세한 내용은 이용 약관을 참고하세요.
면책사항
이 정보와 게시물은 TradingView에서 제공하거나 보증하는 금융, 투자, 거래 또는 기타 유형의 조언이나 권고 사항을 의미하거나 구성하지 않습니다. 자세한 내용은 이용 약관을 참고하세요.