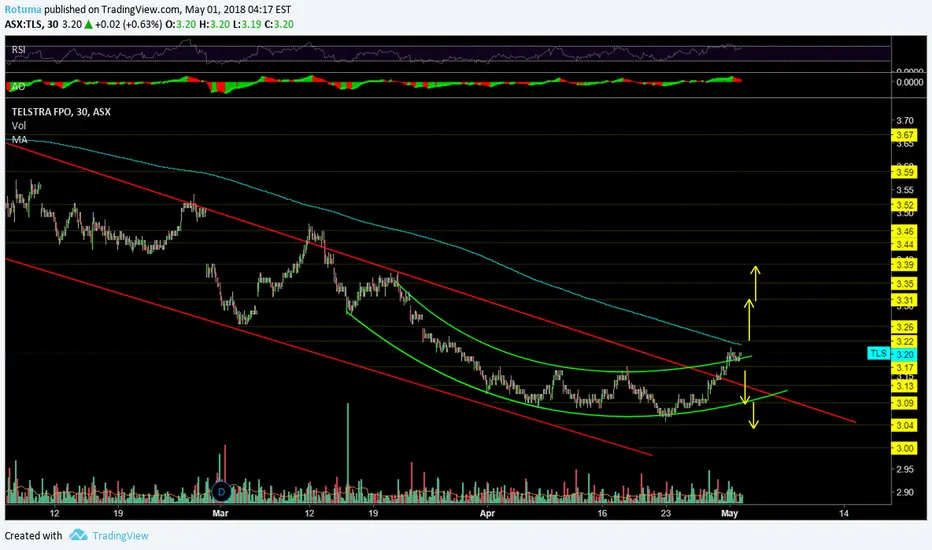
I have been watching TLS shares trading activities closely with great interest for the last six trading days and noticed an increase in volume and momentum to the upside. Share prices closed today's session 1/5/2018 in the green zone for 6 consecutive days.
It has also broken out of the downward price channel to the upside closing just above 3.17, a critical resistance price point no turn support.
Share prices need to break and hold above 3.22 and also it's 500 EMA in blue colour before we could confirm a reversal to the upside.If successful then we could be looking at 3.26 and 3.31 the next two target/resistance price points
Failure to hold above 3.17 could see prices fall to around 3.13-3.09
면책사항
이 정보와 게시물은 TradingView에서 제공하거나 보증하는 금융, 투자, 거래 또는 기타 유형의 조언이나 권고 사항을 의미하거나 구성하지 않습니다. 자세한 내용은 이용 약관을 참고하세요.
면책사항
이 정보와 게시물은 TradingView에서 제공하거나 보증하는 금융, 투자, 거래 또는 기타 유형의 조언이나 권고 사항을 의미하거나 구성하지 않습니다. 자세한 내용은 이용 약관을 참고하세요.