📊 Price summary
Current price ~ ₹875-₹890 (varies by source).
Day’s range: approx ₹864.10 (low) → ₹891.90 (high).
52-week range: low ~ ₹654.55, high ~ ₹1,370.00.
🔍 Key intraday levels
Support zone: Around ₹860–₹865 (near recent day-low ~₹864).
Immediate resistance: Near day-high ~₹890; breaking above could open towards ₹900+ in short term.
Mid-range pivot: ~₹875-₹880 (current price zone) — watch for consolidation or breakout from here.
If price falls below ~₹860, next support may be toward the lower end of the day’s range (₹850s) and then toward previous lows.
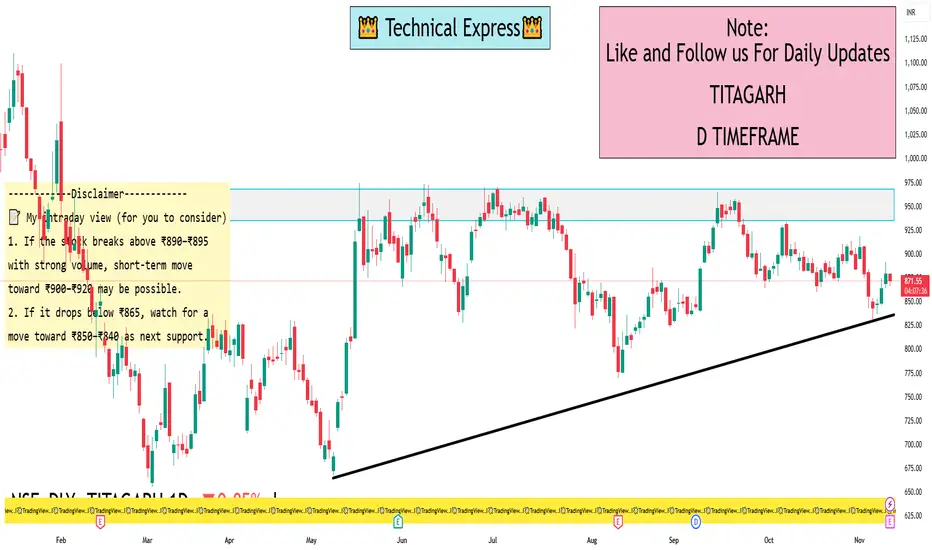
📝 My intraday view (for you to consider)
If the stock breaks above ₹890–₹895 with strong volume, short-term move toward ₹900–₹920 may be possible.
If it drops below ₹865, watch for a move toward ₹850–₹840 as next support.
Stay alert to news/events (order wins, capacity announcements, sector policy) because they can shift momentum quickly.
Current price ~ ₹875-₹890 (varies by source).
Day’s range: approx ₹864.10 (low) → ₹891.90 (high).
52-week range: low ~ ₹654.55, high ~ ₹1,370.00.
🔍 Key intraday levels
Support zone: Around ₹860–₹865 (near recent day-low ~₹864).
Immediate resistance: Near day-high ~₹890; breaking above could open towards ₹900+ in short term.
Mid-range pivot: ~₹875-₹880 (current price zone) — watch for consolidation or breakout from here.
If price falls below ~₹860, next support may be toward the lower end of the day’s range (₹850s) and then toward previous lows.
📝 My intraday view (for you to consider)
If the stock breaks above ₹890–₹895 with strong volume, short-term move toward ₹900–₹920 may be possible.
If it drops below ₹865, watch for a move toward ₹850–₹840 as next support.
Stay alert to news/events (order wins, capacity announcements, sector policy) because they can shift momentum quickly.
I built a Buy & Sell Signal Indicator with 85% accuracy.
📈 Get access via DM or
WhatsApp: wa.link/d997q0
Contact - +91 76782 40962
| Email: techncialexpress@gmail.com
| Script Coder | Trader | Investor | From India
📈 Get access via DM or
WhatsApp: wa.link/d997q0
Contact - +91 76782 40962
| Email: techncialexpress@gmail.com
| Script Coder | Trader | Investor | From India
관련 발행물
면책사항
해당 정보와 게시물은 금융, 투자, 트레이딩 또는 기타 유형의 조언이나 권장 사항으로 간주되지 않으며, 트레이딩뷰에서 제공하거나 보증하는 것이 아닙니다. 자세한 내용은 이용 약관을 참조하세요.