📊 Script: TECHM
📊 Industry: IT - Software (Computers - Software & Consulting)
Key highlights: 💡⚡
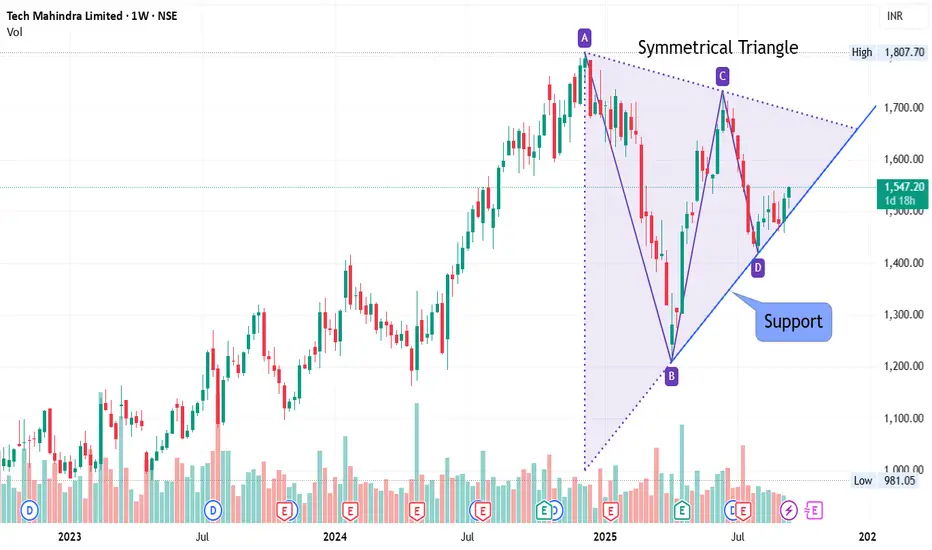
📈On Weekly Chart Script is forming symmetrical triangle and trading near support line.
📈 Script is trading at upper band of BB.
📈 MACD and Double Moving Averages are giving Crossover
📈 Right now RSI is around 58.
📈 One can go for Swing Trade.
⏱️ C.M.P 📑💰- 1547
🟢 Target 🎯🏆 - 1612 / 1655
⚠️ Stoploss ☠️🚫 - 1499
⚠️ Important: Always maintain your Risk & Reward Ratio.
✅Like and follow to never miss a new idea!✅
Disclaimer: I am not SEBI Registered Advisor. My posts are purely for training and educational purposes.
Eat🍜 Sleep😴 TradingView📈 Repeat 🔁
Happy learning with trading. Cheers!🥂
📊 Industry: IT - Software (Computers - Software & Consulting)
Key highlights: 💡⚡
📈On Weekly Chart Script is forming symmetrical triangle and trading near support line.
📈 Script is trading at upper band of BB.
📈 MACD and Double Moving Averages are giving Crossover
📈 Right now RSI is around 58.
📈 One can go for Swing Trade.
⏱️ C.M.P 📑💰- 1547
🟢 Target 🎯🏆 - 1612 / 1655
⚠️ Stoploss ☠️🚫 - 1499
⚠️ Important: Always maintain your Risk & Reward Ratio.
✅Like and follow to never miss a new idea!✅
Disclaimer: I am not SEBI Registered Advisor. My posts are purely for training and educational purposes.
Eat🍜 Sleep😴 TradingView📈 Repeat 🔁
Happy learning with trading. Cheers!🥂
면책사항
해당 정보와 게시물은 금융, 투자, 트레이딩 또는 기타 유형의 조언이나 권장 사항으로 간주되지 않으며, 트레이딩뷰에서 제공하거나 보증하는 것이 아닙니다. 자세한 내용은 이용 약관을 참조하세요.
면책사항
해당 정보와 게시물은 금융, 투자, 트레이딩 또는 기타 유형의 조언이나 권장 사항으로 간주되지 않으며, 트레이딩뷰에서 제공하거나 보증하는 것이 아닙니다. 자세한 내용은 이용 약관을 참조하세요.