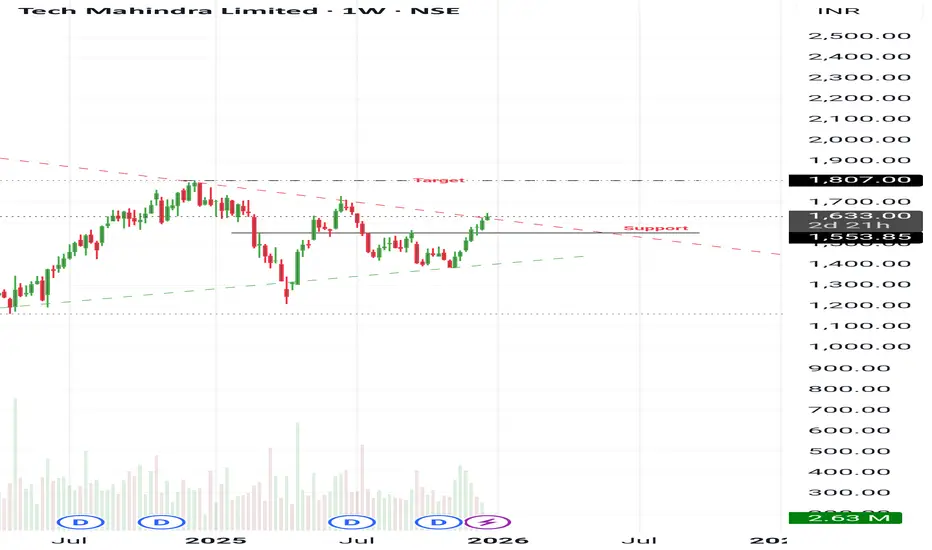
Tech Mahindra is trading inside a tightening weekly structure formed by a descending trendline from the previous highs and a rising support line from the recent lows. This price action indicates compression, suggesting that the stock is building energy for a directional move.
The stock previously faced rejection near the 1800–1810 zone and corrected lower. Since then, price has been forming higher lows while repeatedly testing the falling trendline, showing gradual strength but no confirmed breakout yet.
The zone around 1550–1560 has acted as an important support level and is currently being respected. As long as price holds above this support on a weekly closing basis, the structure remains constructive.
A confirmed breakout will occur only on a sustained weekly close above the descending trendline near 1650. Until that happens, price remains within the consolidation range.
Key Levels
Support Zone: 1550–1560
Major Support: 1440
Breakout Level: 1650
Resistance / Target Zone: 1800–1810
Study Conclusion
This is not a fresh breakout.
It is a trendline retest and compression setup, where directional expansion is expected only after confirmation above resistance.
면책사항
해당 정보와 게시물은 금융, 투자, 트레이딩 또는 기타 유형의 조언이나 권장 사항으로 간주되지 않으며, 트레이딩뷰에서 제공하거나 보증하는 것이 아닙니다. 자세한 내용은 이용 약관을 참조하세요.
면책사항
해당 정보와 게시물은 금융, 투자, 트레이딩 또는 기타 유형의 조언이나 권장 사항으로 간주되지 않으며, 트레이딩뷰에서 제공하거나 보증하는 것이 아닙니다. 자세한 내용은 이용 약관을 참조하세요.