## TDPOWERSYS Price Details (as of August 8, 2025)
### Market Metrics
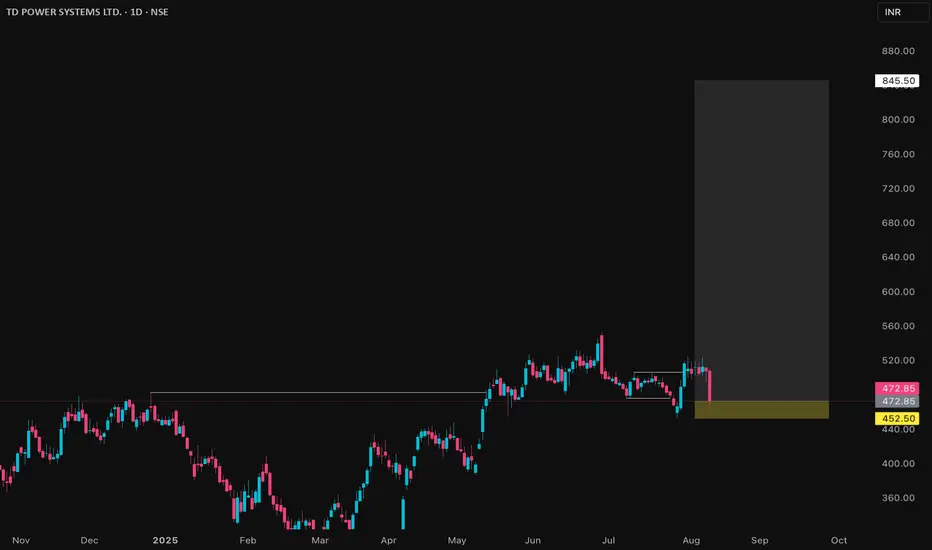
- Current share price is ₹472.85.
- Market capitalization is ₹7,385crore.
- The 52-week price range is ₹293 to ₹552.75.
- Its all-time low was ₹14 in March 2020; all-time high is ₹552.75 in June 2025.
### Returns & Volatility
- 1-month return: -1.48%.
- 1-year return: about 18%-20%.
- 3-year return: over 300%.
- 5-year return: over 1,900%.
- Weekly volatility is 6%, which is above average.
- Beta is 2.04, indicating higher risk and volatility versus the overall market.
### Valuation
- Price/Earnings Ratio: 42.31, higher than sector average.
- Price/Book Ratio: 8.58, above sector average.
- Dividend yield is 0.25%.
### Company Fundamentals
- Trailing 12-month revenue: ₹13.77billion.
- Net Profit Margin: 13.75%.
- EPS: ₹12.12.
- Gross margin: 34.13%.
- Debt to equity: 1.4%, showing low leverage.
### Valuation Analysis
- Estimated intrinsic value is ₹258.02.
- Current price is about 45% over this value, meaning the stock is overvalued.
### Qualitative Notes
- Strong profitability and cash flow, but price reflects high growth expectations.
- High volatility, especially in the short term.
- Dividend policy: small but regular.
- Recent technical signals showed buy recommendations, but the stock has been correcting lately.
**Overall:** The stock is highly priced relative to its value and historical norms, with impressive growth but also increased volatility and a potential for continued price correction.
### Market Metrics
- Current share price is ₹472.85.
- Market capitalization is ₹7,385crore.
- The 52-week price range is ₹293 to ₹552.75.
- Its all-time low was ₹14 in March 2020; all-time high is ₹552.75 in June 2025.
### Returns & Volatility
- 1-month return: -1.48%.
- 1-year return: about 18%-20%.
- 3-year return: over 300%.
- 5-year return: over 1,900%.
- Weekly volatility is 6%, which is above average.
- Beta is 2.04, indicating higher risk and volatility versus the overall market.
### Valuation
- Price/Earnings Ratio: 42.31, higher than sector average.
- Price/Book Ratio: 8.58, above sector average.
- Dividend yield is 0.25%.
### Company Fundamentals
- Trailing 12-month revenue: ₹13.77billion.
- Net Profit Margin: 13.75%.
- EPS: ₹12.12.
- Gross margin: 34.13%.
- Debt to equity: 1.4%, showing low leverage.
### Valuation Analysis
- Estimated intrinsic value is ₹258.02.
- Current price is about 45% over this value, meaning the stock is overvalued.
### Qualitative Notes
- Strong profitability and cash flow, but price reflects high growth expectations.
- High volatility, especially in the short term.
- Dividend policy: small but regular.
- Recent technical signals showed buy recommendations, but the stock has been correcting lately.
**Overall:** The stock is highly priced relative to its value and historical norms, with impressive growth but also increased volatility and a potential for continued price correction.
액티브 트레이드
16% + Move in less then 25 days almost 3 years fd gains거래청산: 타겟 닿음
39%+ ROI, 5 YEARS+ FD gainst in less then 2 months노트
66%+ ROI almost 15+ RR Captured 면책사항
이 정보와 게시물은 TradingView에서 제공하거나 보증하는 금융, 투자, 거래 또는 기타 유형의 조언이나 권고 사항을 의미하거나 구성하지 않습니다. 자세한 내용은 이용 약관을 참고하세요.
면책사항
이 정보와 게시물은 TradingView에서 제공하거나 보증하는 금융, 투자, 거래 또는 기타 유형의 조언이나 권고 사항을 의미하거나 구성하지 않습니다. 자세한 내용은 이용 약관을 참고하세요.