Weekly Technical Overview
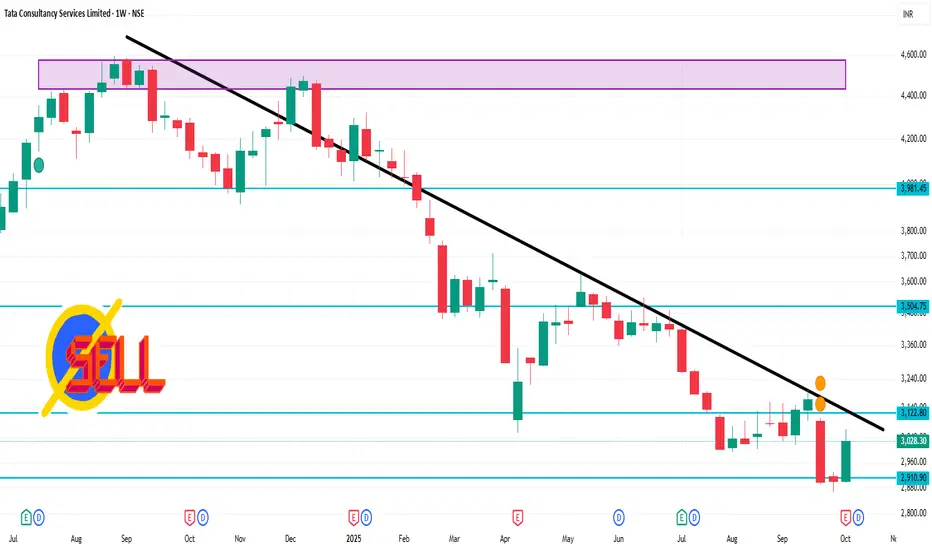
Current Price: ₹3,028.30 on the NSE
52-Week Range: ₹2,866.60 – ₹4,494.90
Volume: Approximately 8.8 million shares traded this week
VWAP: ₹3,032.15
Market Cap: ₹1.095 trillion
Beta: 0.97 (indicating moderate volatility
🔍 Key Technical Indicators
Moving Averages: TCS is trading below its 200-day moving average, suggesting a bearish trend.
RSI: The Relative Strength Index is in the neutral zone, indicating balanced buying and selling pressures.
MACD: The Moving Average Convergence Divergence is showing a bearish crossover, which may signal a potential downward movement.
📈 Outlook
Support Levels: Immediate support is observed around ₹2,950, with a stronger support zone near ₹2,870.
Resistance Levels: Key resistance is at ₹3,100, followed by ₹3,200.
Volatility: The stock's beta of 0.97 suggests that it moves in line with the broader market, with moderate volatility.
관련 발행물
면책사항
해당 정보와 게시물은 금융, 투자, 트레이딩 또는 기타 유형의 조언이나 권장 사항으로 간주되지 않으며, 트레이딩뷰에서 제공하거나 보증하는 것이 아닙니다. 자세한 내용은 이용 약관을 참조하세요.
관련 발행물
면책사항
해당 정보와 게시물은 금융, 투자, 트레이딩 또는 기타 유형의 조언이나 권장 사항으로 간주되지 않으며, 트레이딩뷰에서 제공하거나 보증하는 것이 아닙니다. 자세한 내용은 이용 약관을 참조하세요.