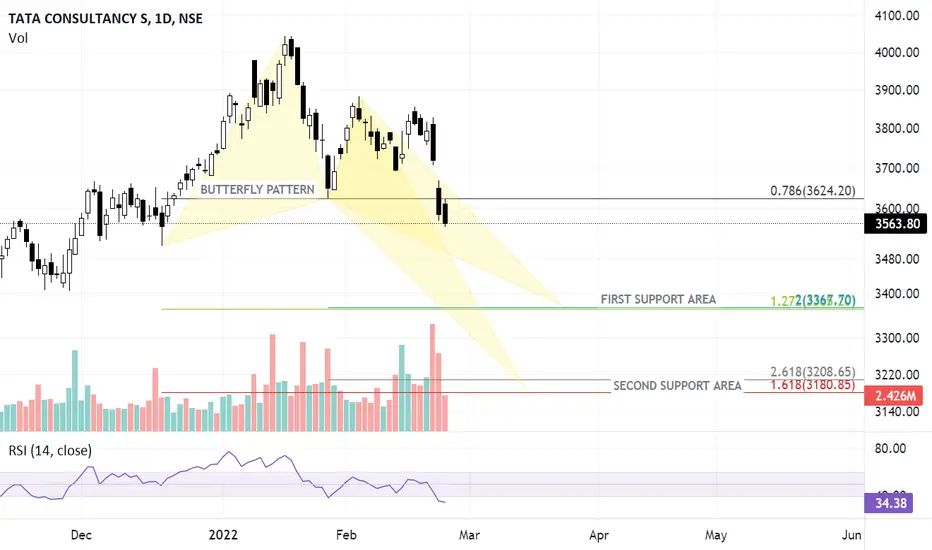
TCS is currently in a correction mode, and it is likely that we may see further weakness in the stock, and stock could move lower to 3400 to 3200 levels in the near term.
This is a great stock for Investment and for positional trading also.
I can see butterfly pattern formation on its daily chart, which is suggesting a good support area around 3400 -3367 levels and at 3180-3208
Stock can be bought in tranches as both of these levels can be seen in the stocks.
Disclaimer: Not a recommendation to trade.
면책사항
이 정보와 게시물은 TradingView에서 제공하거나 보증하는 금융, 투자, 거래 또는 기타 유형의 조언이나 권고 사항을 의미하거나 구성하지 않습니다. 자세한 내용은 이용 약관을 참고하세요.
면책사항
이 정보와 게시물은 TradingView에서 제공하거나 보증하는 금융, 투자, 거래 또는 기타 유형의 조언이나 권고 사항을 의미하거나 구성하지 않습니다. 자세한 내용은 이용 약관을 참고하세요.