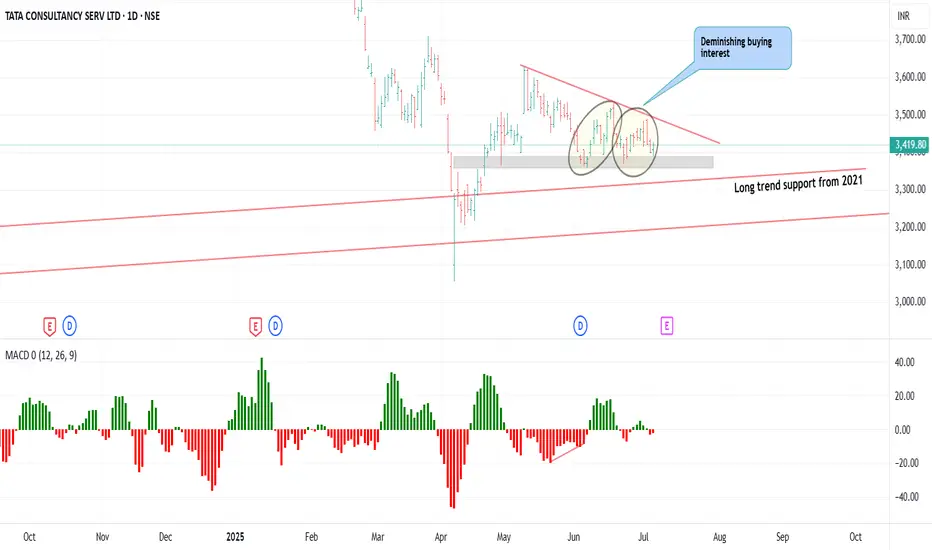
TCS 3419 is showing a descending triangle pattern.
Buying interest diminishing could be seen in the chart.
3480 is resistance and 3362 is support.
Signals suggest possible short weakness drop to support and then reverse to resistance
Day PCR is bearish at 0.74 while intraday at 2.34 suggests long buildup.
PUT premiums are higher than Call Premium suggests a shakeout is possible to trap the PUT writers.
면책사항
해당 정보와 게시물은 금융, 투자, 트레이딩 또는 기타 유형의 조언이나 권장 사항으로 간주되지 않으며, 트레이딩뷰에서 제공하거나 보증하는 것이 아닙니다. 자세한 내용은 이용 약관을 참조하세요.
면책사항
해당 정보와 게시물은 금융, 투자, 트레이딩 또는 기타 유형의 조언이나 권장 사항으로 간주되지 않으며, 트레이딩뷰에서 제공하거나 보증하는 것이 아닙니다. 자세한 내용은 이용 약관을 참조하세요.