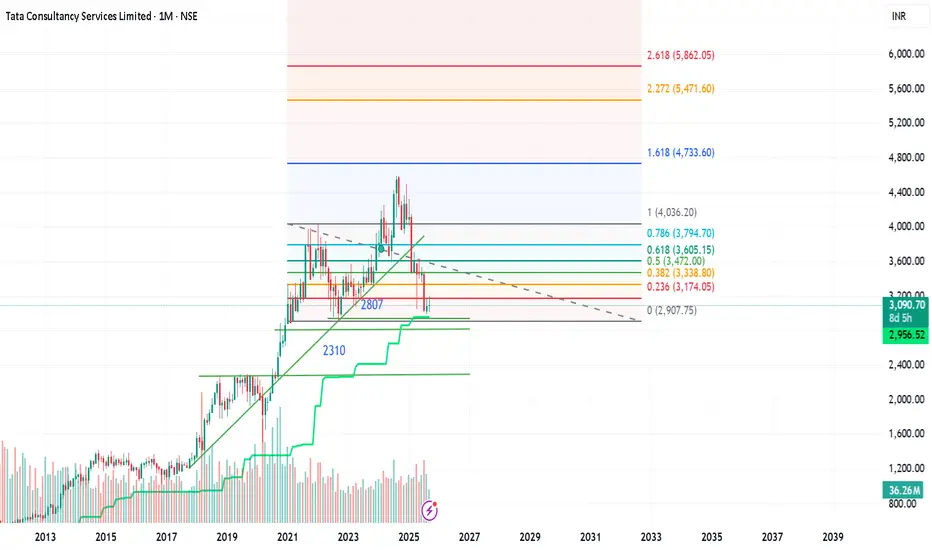
Trend Overview
- Long-term uptrend: From 2013 to around 2021, TCS showed a strong bullish trajectory.
- Recent consolidation: Post-2021, the price has been range-bound, suggesting indecision or accumulation.
🔍 Key Technical Insights
1. Fibonacci Levels
These help identify potential support/resistance zones and price targets:
- Current price: ₹3,094 is hovering near the 0.382 retracement level (₹3,059.60), which often acts as a pivot.
- Support zones:
- ₹2,891.10 (0.5 level)
- ₹2,722.60 (0.618 level)
- ₹2,488.35 (0.786 level)
- Upside targets (if bullish momentum resumes):
- ₹3,763.60 (1.618 extension)
- ₹4,191.10 (2.0 extension)
- ₹5,085.10 (2.618 extension)
2. Support Levels
- ₹2,800: A strong horizontal support, tested multiple times.
- ₹2,310: Deeper support, possibly a long-term floor if broader correction occurs.
3. Buy/Sell Signal
- BUY: ₹3,094.00
- SELL: ₹3,091.30
This narrow spread suggests a neutral stance or low volatility at the moment.
4. Trend Line
- The green line likely represents a moving average or trendline support, reinforcing the ₹2,800 zone as a key level to watch.
5. Volume
- Volume bars show participation. Any spike near support/resistance levels can confirm breakout or reversal strength.
🧠 Interpretation for Traders
- Bullish bias if price holds above ₹3,059 and breaks ₹3,263 (0.236 level).
- Bearish risk if price breaks below ₹2,891 and heads toward ₹2,722 or ₹2,488.
- Neutral zone between ₹2,891 and ₹3,263—ideal for range trading or waiting for confirmation.
Would you like me to overlay Gann levels or model a payoff scenario based on this chart? I can also help you build a dynamic dashboard to track these zones live.
면책사항
해당 정보와 게시물은 금융, 투자, 트레이딩 또는 기타 유형의 조언이나 권장 사항으로 간주되지 않으며, 트레이딩뷰에서 제공하거나 보증하는 것이 아닙니다. 자세한 내용은 이용 약관을 참조하세요.
면책사항
해당 정보와 게시물은 금융, 투자, 트레이딩 또는 기타 유형의 조언이나 권장 사항으로 간주되지 않으며, 트레이딩뷰에서 제공하거나 보증하는 것이 아닙니다. 자세한 내용은 이용 약관을 참조하세요.