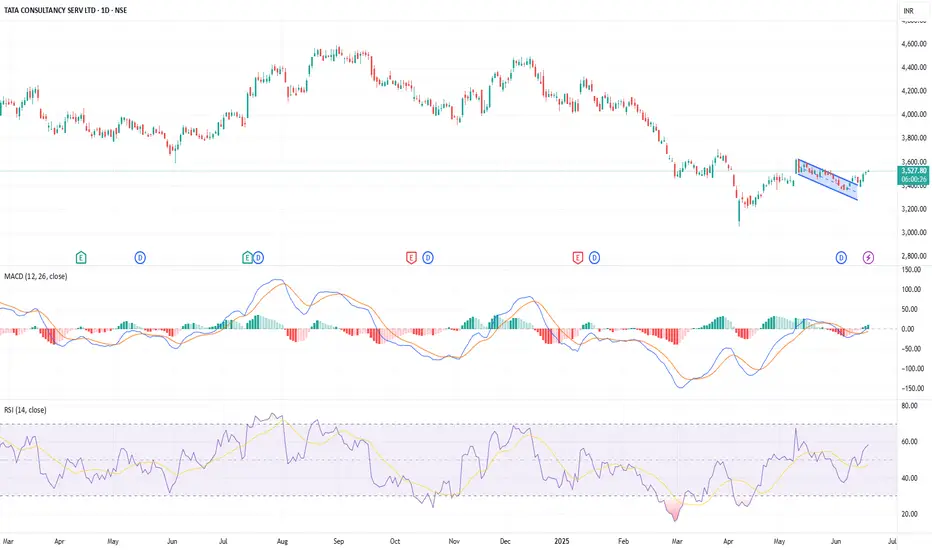
Breakout from a bullish falling wedge pattern and retesting the same breakout zone gives confidence of positive reversal probably. MACD crossover with rising histogram indicates strong momentum. RSI at 58.58, rising with room for further upside. Price sustaining above the wedge confirms breakout strength. Overall setup suggests a positive short-term trend continuation.
This is just for educational purpose and I am not giving any recommendation or target for TCS.
This is just for educational purpose and I am not giving any recommendation or target for TCS.
관련 발행물
면책사항
해당 정보와 게시물은 금융, 투자, 트레이딩 또는 기타 유형의 조언이나 권장 사항으로 간주되지 않으며, 트레이딩뷰에서 제공하거나 보증하는 것이 아닙니다. 자세한 내용은 이용 약관을 참조하세요.
면책사항
해당 정보와 게시물은 금융, 투자, 트레이딩 또는 기타 유형의 조언이나 권장 사항으로 간주되지 않으며, 트레이딩뷰에서 제공하거나 보증하는 것이 아닙니다. 자세한 내용은 이용 약관을 참조하세요.